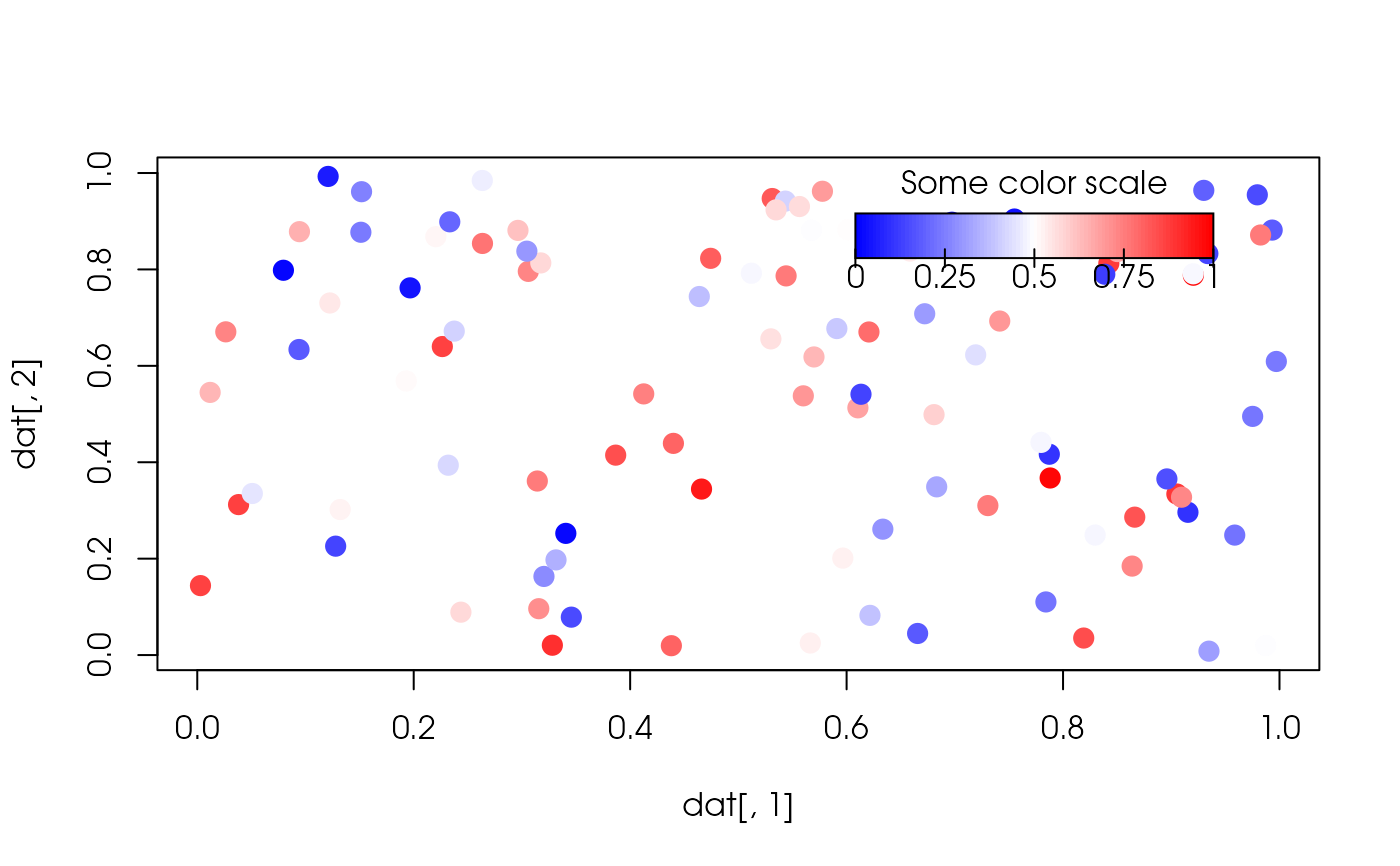
Function to create a color key
Arguments
- x0, x1, y0, y1
Numeric scalars. Coordinates of the lower left and upper right points where the color key will be drawn as proportion of the plotting region.
- cols
Character scalar. Colors specifications to create the color palette.
- tick.range, tick.marks
Numeric vectors specifying the range and the tickmarks respectively.
- label.from, label.to
Character scalar. Labels of the lower and upper values of the color key.
- nlevels
Integer scalar. Number of levels to extrapolate.
- main
Character scalar. Title of the colorkey.
- relative
Logical scalar. When
TRUEthe color key is drawn relative to the plotting region area takingx0, x1, y0, y1as relative location.- tick.args, label.args, main.args
Lists of arguments passed to graphics::text for drawing ticks, labels and main respectively.
Examples
set.seed(22231)

# A random figure
dat <- matrix(runif(100*3), ncol = 3)
col <- colorRamp2(c("blue", "white", "red"))

plot(
  dat[,1], dat[,2],
  col = rgb(col(dat[,3]), maxColorValue=255),
  cex=2, pch=20
  )

# Pretty color key
colorkey(
  x0 = .60, y0 = .80,
  x1 = .95, y1 = .95,
  cols = c("blue", "white", "red"),
  main = "Some color scale"
)