
While similar to graphics::pie(), this function is much more
flexible as it allows providing different parameters for each slice of the pie.
Furthermore, it allows adding the plot to the current device, making it possible
to create compound piecharts.
Arguments
- x
Numeric vector. Values that specify the area of the slices.
- labels
Character vector of length
length(x). Passed tographics::text().- radius
Numeric vector. Radious of each slice (can be a scalar).
- doughnut
Numeric scalar. Radious of each inner circle (doughnut) (can be a scalar).
- origin
Numeric vector of length 2. Coordinates of the origin.
- edges
Numeric scalar. Smoothness of the slices curve (can be a vector).
- slice.off
Numeric vector. When
!=0, specifies how much to move the slice away from the origin. When scalar is recycled.- init.angle
Numeric scalar. Angle from where to start drawing in degrees.
- last.angle
Numeric scalar. Angle where to finish drawing in degrees.
- tick.len
Numeric scalar. Size of the tick marks as proportion of the radius.
- text.args
List. Further arguments passed to
graphics::text().- segments.args
List. Further arguments passed to
graphics::segments()when drawing the tickmarks.- skip.plot.slices
Logical scalar. When
FALSE, slices are not drawn. This can be useful if, for example, the user only wants to draw the labels.- add
Logical scalar. When
TRUEit is added to the current device.- rescale
Logical scalar. When
TRUE(default), the y-coordinates of the polygons (slices), text and tickmarks will be rescaled such that the aspectt ratio is preserved, i.e. looks like a circle.- ...
Further arguments passed to
graphics::polygon()(see details).
Value
A list with the following elements:
- slices
A list of length
length(x)with the coordinates of each slice.- textcoords
A numeric matrix of size
length(x)*2with coordinates where the labels can be put at.- alpha0
A numeric vector of size
length(x)with the starting degree in radians of the slice.- alpha1
A numeric vector of size
length(x)with the ending degree in radians of the slice.
Details
The function is a wrapper of graphics::polygon(),
so all parameters such as color, density, border, etc. are passed directly
by mapply() so that are specified one per slice. The coordinates
of the slices are computed internally.
Examples
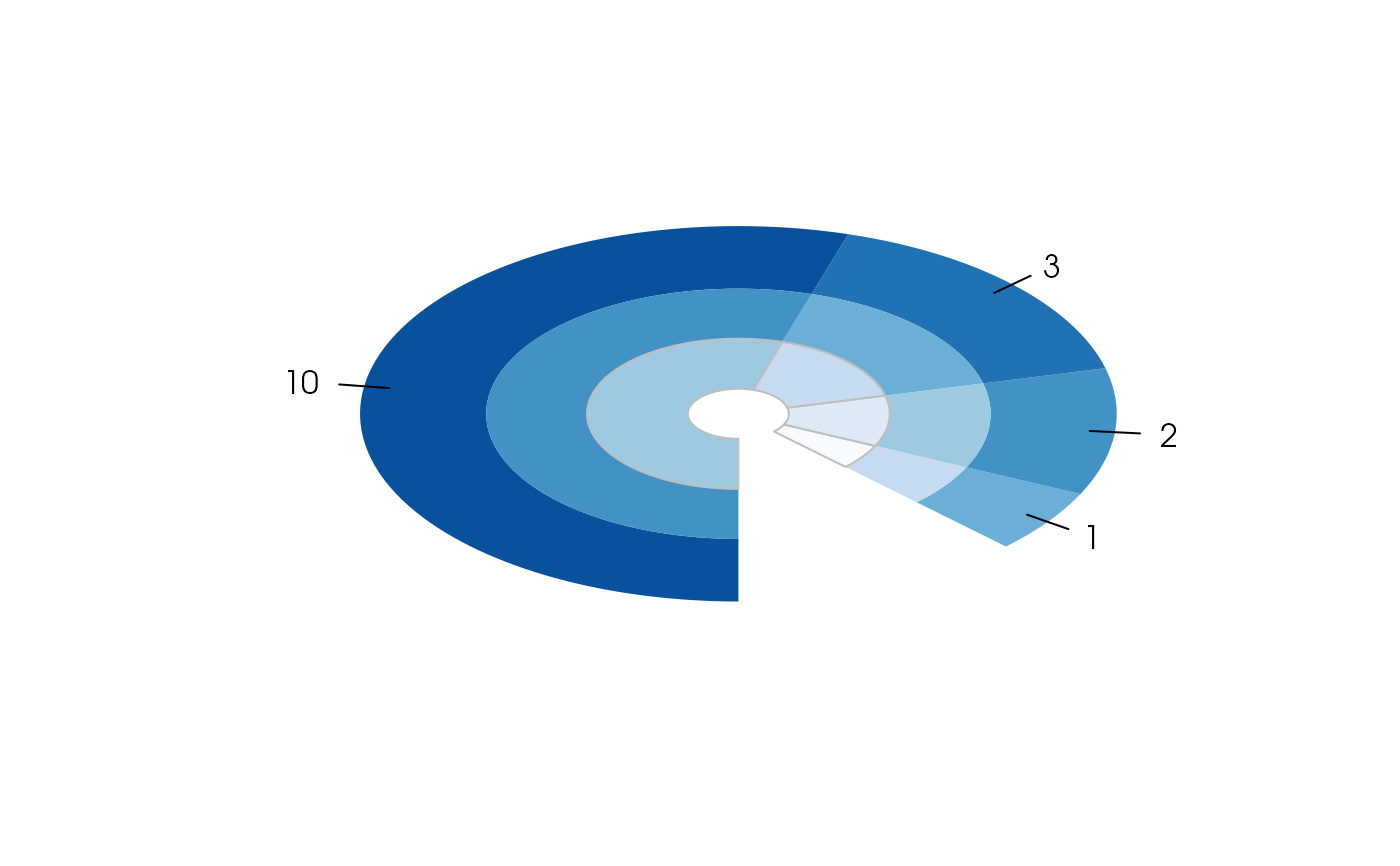
# Example 1 -----------------------------------------------------------------
# A set of 3 nested rings rings starting at 315 deg. and ending at 270 deg.
# Values to plot
vals <- c(1,2,3,10)
# Outer (includes labels)
piechart(vals, col=grDevices::blues9[5:8], border=NA, doughnut = .5,
radius=.75, labels=vals, init.angle = 315, last.angle = 270)
# Middle
piechart(vals, col=grDevices::blues9[3:6], border=NA, doughnut = .3,
radius=.5, add=TRUE, init.angle = 315, last.angle = 270)
# Inner
piechart(vals, col=grDevices::blues9[1:4], border="gray", doughnut = .1,
radius=.3, add=TRUE, init.angle = 315, last.angle = 270)
 # Example 2 -----------------------------------------------------------------
# Passing values to polygon and playing with the radius and slice.off
piechart(1:10, density=(1:10)^2/2, slice.off = (1:10)/30, doughnut = .5,
radius = sqrt(10:1),
# Here we are setting random labels...
labels=sapply(1:10, function(x) paste(sample(letters, x, TRUE), collapse=""))
)
# Example 2 -----------------------------------------------------------------
# Passing values to polygon and playing with the radius and slice.off
piechart(1:10, density=(1:10)^2/2, slice.off = (1:10)/30, doughnut = .5,
radius = sqrt(10:1),
# Here we are setting random labels...
labels=sapply(1:10, function(x) paste(sample(letters, x, TRUE), collapse=""))
)