Using vertex/edge attributes, these functions return vectors of colors
that can be used either during the creation of the nplot object, or
afterwards when changing gpar (graphical parameter) values with set_gpar.
Usage
make_colors(dat, categorical = FALSE, color_map = grDevices::hcl.colors)

make_edges_colors(x, eattr, ...)

make_vertex_colors(x, vattr, ...)
Arguments
- dat
A vector of data to generate the color from.
- categorical
Logical. When
TRUEsets the colors as categories.- color_map
A function to generate a palette.
- x
A graph of class
networkorigraph.- ...
Further arguments passed to
make_colors.- vattr, eattr
Character. Names of either vertex or edge variables to be used for generating the colors.
Details
If no attribute is provided, then by defaul the colors are set according to indegree.
x can be either a graph of class igraph or network.
Examples
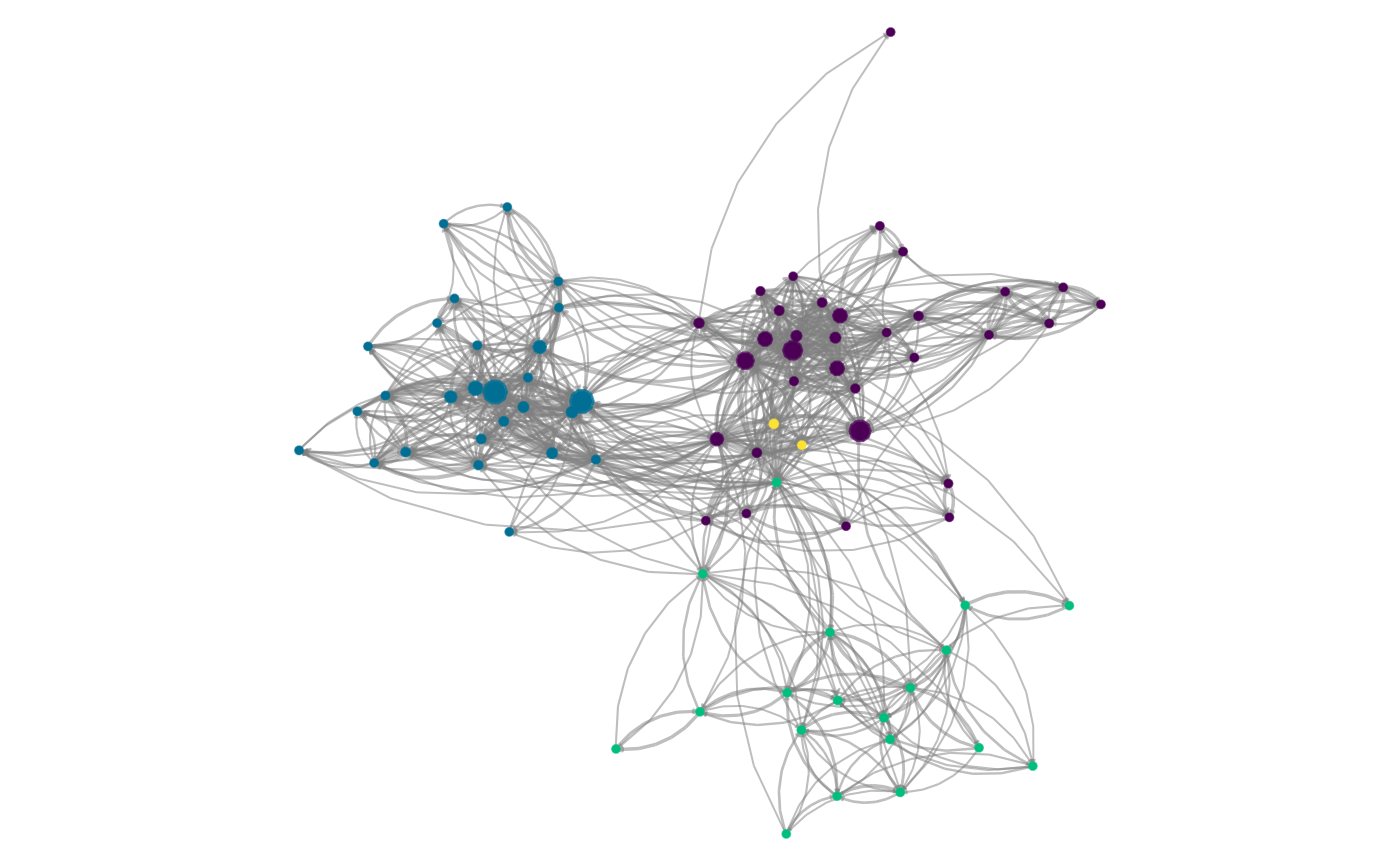
data(UKfaculty, package="igraphdata")
col <- make_vertex_colors(UKfaculty, "Group")
#> This graph was created by an old(er) igraph version.
#> ℹ Call `igraph::upgrade_graph()` on it to use with the current igraph version.
#> For now we convert it on the fly...

if (require(magrittr)) {

  nplot(UKfaculty) %>%
    set_vertex_gpar("core", fill = col, col=col) %>%
    set_vertex_gpar("frame", fill = col, col=col, alpha=.7) %>%
    set_edge_gpar(col="gray50", fill="gray50", alpha=.5)
}
#> Loading required package: magrittr