nplot() is the main function of the netplot package. It draws a network
using the grid graphics system (the same engine that powers ggplot2),
emphasizing aesthetics and providing sensible defaults that yield
out-of-the-box nice visualizations. Compared with base igraph/network
plots, nplot() auto-scales vertices and edges relative to the plotting
device, draws truly curved edges, mixes edge colors from their endpoints,
and fills the device efficiently.
Usage
nplot(
  x,
  layout,
  vertex.size = 1,
  bg.col = "transparent",
  vertex.nsides = 10,
  vertex.color = grDevices::hcl.colors(1),
  vertex.size.range = c(0.01, 0.03, 4),
  vertex.frame.color = NULL,
  vertex.rot = 0,
  vertex.frame.prop = 0.2,
  vertex.label = NULL,
  vertex.label.fontsize = NULL,
  vertex.label.color = adjustcolor("black", alpha.f = 0.8),
  vertex.label.fontfamily = "sans",
  vertex.label.fontface = "plain",
  vertex.label.show = 0.3,
  vertex.label.range = c(5, 15),
  edge.width = 1,
  edge.width.range = c(1, 2),
  edge.arrow.size = NULL,
  edge.color = ~ego(alpha = 0.1, col = "gray") + alter,
  edge.curvature = pi/3,
  edge.line.lty = "solid",
  edge.line.breaks = 5,
  sample.edges = 1,
  skip.vertex = FALSE,
  skip.edges = FALSE,
  skip.arrows = skip.edges,
  add = FALSE,
  zero.margins = TRUE,
  edgelist
)

# S3 method for class 'igraph'
nplot(
  x,
  layout = igraph::layout_nicely(x),
  vertex.size = igraph::degree(x, mode = "in"),
  bg.col = "transparent",
  vertex.nsides = 10,
  vertex.color = grDevices::hcl.colors(1),
  vertex.size.range = c(0.01, 0.03, 4),
  vertex.frame.color = NULL,
  vertex.rot = 0,
  vertex.frame.prop = 0.2,
  vertex.label = igraph::vertex_attr(x, "name"),
  vertex.label.fontsize = NULL,
  vertex.label.color = adjustcolor("black", alpha.f = 0.8),
  vertex.label.fontfamily = "sans",
  vertex.label.fontface = "plain",
  vertex.label.show = 0.3,
  vertex.label.range = c(5, 15),
  edge.width = igraph::edge_attr(x, "weight"),
  edge.width.range = c(1, 2),
  edge.arrow.size = NULL,
  edge.color = ~ego(alpha = 0.1, col = "gray") + alter,
  edge.curvature = pi/3,
  edge.line.lty = "solid",
  edge.line.breaks = 5,
  sample.edges = 1,
  skip.vertex = FALSE,
  skip.edges = FALSE,
  skip.arrows = !igraph::is_directed(x),
  add = FALSE,
  zero.margins = TRUE,
  edgelist
)

# S3 method for class 'network'
nplot(
  x,
  layout = sna::gplot.layout.kamadakawai(x, NULL),
  vertex.size = sna::degree(x, cmode = "indegree"),
  bg.col = "transparent",
  vertex.nsides = 10,
  vertex.color = grDevices::hcl.colors(1),
  vertex.size.range = c(0.01, 0.03, 4),
  vertex.frame.color = NULL,
  vertex.rot = 0,
  vertex.frame.prop = 0.2,
  vertex.label = network::get.vertex.attribute(x, "vertex.names"),
  vertex.label.fontsize = NULL,
  vertex.label.color = adjustcolor("black", alpha.f = 0.8),
  vertex.label.fontfamily = "sans",
  vertex.label.fontface = "plain",
  vertex.label.show = 0.3,
  vertex.label.range = c(5, 15),
  edge.width = network::get.edge.attribute(x, "weight"),
  edge.width.range = c(1, 2),
  edge.arrow.size = NULL,
  edge.color = ~ego(alpha = 0.1, col = "gray") + alter,
  edge.curvature = pi/3,
  edge.line.lty = "solid",
  edge.line.breaks = 5,
  sample.edges = 1,
  skip.vertex = FALSE,
  skip.edges = FALSE,
  skip.arrows = !network::is.directed(x),
  add = FALSE,
  zero.margins = TRUE,
  edgelist
)

# S3 method for class 'matrix'
nplot(
  x,
  layout,
  vertex.size = 1,
  bg.col = "transparent",
  vertex.nsides = 10,
  vertex.color = grDevices::hcl.colors(1),
  vertex.size.range = c(0.01, 0.03, 4),
  vertex.frame.color = NULL,
  vertex.rot = 0,
  vertex.frame.prop = 0.2,
  vertex.label = NULL,
  vertex.label.fontsize = NULL,
  vertex.label.color = adjustcolor("black", alpha.f = 0.8),
  vertex.label.fontfamily = "sans",
  vertex.label.fontface = "plain",
  vertex.label.show = 0.3,
  vertex.label.range = c(5, 15),
  edge.width = 1,
  edge.width.range = c(1, 2),
  edge.arrow.size = NULL,
  edge.color = ~ego(alpha = 0.1, col = "gray") + alter,
  edge.curvature = pi/3,
  edge.line.lty = "solid",
  edge.line.breaks = 5,
  sample.edges = 1,
  skip.vertex = FALSE,
  skip.edges = FALSE,
  skip.arrows = skip.edges,
  add = FALSE,
  zero.margins = TRUE,
  edgelist
)

# Default S3 method
nplot(
  x,
  layout,
  vertex.size = 1,
  bg.col = "transparent",
  vertex.nsides = 10,
  vertex.color = grDevices::hcl.colors(1),
  vertex.size.range = c(0.01, 0.03, 4),
  vertex.frame.color = NULL,
  vertex.rot = 0,
  vertex.frame.prop = 0.2,
  vertex.label = NULL,
  vertex.label.fontsize = NULL,
  vertex.label.color = adjustcolor("black", alpha.f = 0.8),
  vertex.label.fontfamily = "sans",
  vertex.label.fontface = "plain",
  vertex.label.show = 0.3,
  vertex.label.range = c(5, 15),
  edge.width = 1,
  edge.width.range = c(1, 2),
  edge.arrow.size = NULL,
  edge.color = ~ego(alpha = 0.1, col = "gray") + alter,
  edge.curvature = pi/3,
  edge.line.lty = "solid",
  edge.line.breaks = 5,
  sample.edges = 1,
  skip.vertex = FALSE,
  skip.edges = FALSE,
  skip.arrows = skip.edges,
  add = FALSE,
  zero.margins = TRUE,
  ...,
  edgelist
)

# S3 method for class 'netplot'
print(x, y = NULL, newpage = TRUE, legend = TRUE, ...)
Arguments
- x
A graph. It supports networks stored as
igraph,network, and matrices objects (see details).- layout
Numeric two-column matrix with the graph layout in x/y positions of the vertices.
- vertex.size
Numeric vector of length
vcount(x). Absolute size of the vertex from 0 to 1. Can also be a one-sided formula (e.g.~ degree) naming a numeric vertex attribute to map sizes from (see "Mapping attributes with formulas").- bg.col
Color of the background.
- vertex.nsides
Numeric vector of length
vcount(x). Number of sides of the vertex. E.g. three is a triangle, and 100 approximates a circle. Can also be a one-sided formula (e.g.~ group) naming a vertex attribute; each unique value is then mapped to a distinct shape (see "Mapping attributes with formulas").- vertex.color
Vector of length
vcount(x). Vertex HEX or built in colors. Can also be a one-sided formula (e.g.~ group) naming a vertex attribute to color vertices by (see "Mapping attributes with formulas").- vertex.size.range
Numeric vector of length 2 or 3, or
NULL. Relative size for the minimum and maximum of the plot, and curvature of the scale. The third number is used assize^rel[3]. IfNULL, scaling is suppressed andvertex.sizeis used as is.- vertex.frame.color
Vector of length
vcount(x). Border of vertex in HEX or built in colors.- vertex.rot
Vector of length
vcount(x)in Radians. Passed to npolygon, elevation degree from which the polygon is drawn.- vertex.frame.prop
Vector of length
vcount(x). What proportion of the vertex does the frame occupy (values between 0 and 1).- vertex.label
Character vector of length
vcount(x). Labels.- vertex.label.fontsize
Numeric vector.
- vertex.label.color
Vector of colors of length
vcount(x).- vertex.label.fontfamily
Character vector of length
vcount(x).- vertex.label.fontface
See grid::gpar
- vertex.label.show
Numeric scalar. Proportion of labels to show as the top ranking according to
vertex.size.- vertex.label.range
Numeric vector of size 2 or 3. Relative scale of
vertex.label.fontsizein points (see grid::gpar).- edge.width
Numeric vector of length
ecount(x). Relative edge widths. Values are normalized and then mapped to the range specified byedge.width.range, unlessedge.width.rangeisNULL. Fornplot.igraphandnplot.network, defaults to the "weight" edge attribute if present; otherwise all edges use width 1. Can also be a one-sided formula (e.g.~ weight) naming a numeric edge attribute (see "Mapping attributes with formulas").- edge.width.range
Numeric vector of length 2, or
NULL. The minimum and maximum line widths (in points) to use when mappingedge.widthvalues. For example,c(1, 4)maps the smallest edge weight to 1pt and the largest to 4pt. IfNULL, scaling is suppressed andedge.widthis used as is.- edge.arrow.size
Vector of length
ecount(x)from 0 to 1.- edge.color
A vector of length
ecount(x). In HEX or built in colors. Can beNULLin which case the color is picked as a mixture between ego and alters'vertex.colorvalues.- edge.curvature
Numeric vector of length
ecount(x). Curvature of edges in terms of radians.- edge.line.lty
Vector of length
ecount(x). Line types in R (e.g.- 1 = Solid, 2 = Dashed, etc).- edge.line.breaks
Vector of length
ecount(x). Number of vertices to draw (approximate) the arc (edge).- sample.edges
Numeric scalar between 0 and 1. Proportion of edges to sample.
- skip.vertex, skip.edges, skip.arrows
Logical scalar. When
TRUEthe object is not plotted.- add
Logical scalar.
- zero.margins
Logical scalar.
- edgelist
An edgelist.
- y, ...
Ignored
- newpage
Logical scalar. When
TRUEcalls grid::grid.newpage.- legend
Logical scalar. When
TRUEit adds a legend.
Value
An object of class c("netplot", "gTree", "grob", "gDesc"). The object
has an additional set of attributes:
.xlim, .ylimvector of size two with the x-asis/y-axis limits..layoutA numeric matrix of sizevcount(x) * 2with the vertices positions.edgelistA numeric matrix, The edgelist.
In the case of nplot.default, an object of class netplot and grob (see
grid::grob) with the following slots:
childrenThe maingrobof the object.nameCharacter scalar. The name of the plot.xlimand.ylimTwo vectors indicating the limits of the plot.layoutA two-column matrix with the location of the vertices..edgelistA two-column matrix, an edgelist..NInteger. The number of vertices..MInteger. The number of edges.
The children grob contains the following two objects:
backgroundagrobrectangule.graphagTreethat contains each vertex and each edge of the figure.
Details
Vertex and edge aesthetics can be set directly (passing a vector) or,
conveniently, mapped from graph attributes using a formula interface (see
the "Mapping attributes with formulas" section below). The returned object is
a grid grob, so it can be further edited with set_vertex_gpar() /
set_edge_gpar(), combined with other grid graphics (e.g. via
gridExtra::grid.arrange()), or annotated with a legend through
nplot_legend().
When x is of class matrix, it will be passed to igraph::graph_from_adjacency_matrix().
Mapping attributes with formulas
Several aesthetics can be mapped directly from graph attributes by passing a one-sided formula naming the attribute, instead of building the vector by hand. The mapping depends on the aesthetic:
vertex.color = ~ attrcolors vertices by the vertex attributeattr. Character/factor attributes are mapped to a categorical palette, numeric attributes to a continuous gradient, and logical attributes to two colors. When used this way,print()-ing the resulting plot also draws a matching legend: a categorical key for discrete attributes and a continuous color bar for continuous ones.vertex.nsides = ~ attrmaps each unique value ofattrto a distinct vertex shape (triangle, square, pentagon, ...).vertex.size = ~ attrandedge.width = ~ attrscale sizes/widths from a numeric vertex/edge attribute.edge.coloruses a different, richer formula grammar based onego()andalter()to mix the endpoints' colors; see netplot-formulae.
For vertex.nsides, vertex.size, and edge.width the right-hand side of
the formula is evaluated with the graph's attributes in scope, so besides
bare names you can use expressions, e.g. edge.width = ~ log1p(weight) or
vertex.size = ~ degree ^ 2.
For example, nplot(x, vertex.color = ~ gender, vertex.size = ~ degree)
colors vertices by the gender attribute and sizes them by degree. The
same attribute-mapping formulas also work in set_vertex_gpar().
Examples
library(igraph)
library(netplot)
set.seed(1)
x <- sample_smallworld(1, 200, 5, 0.03)
plot(x) # ala igraph
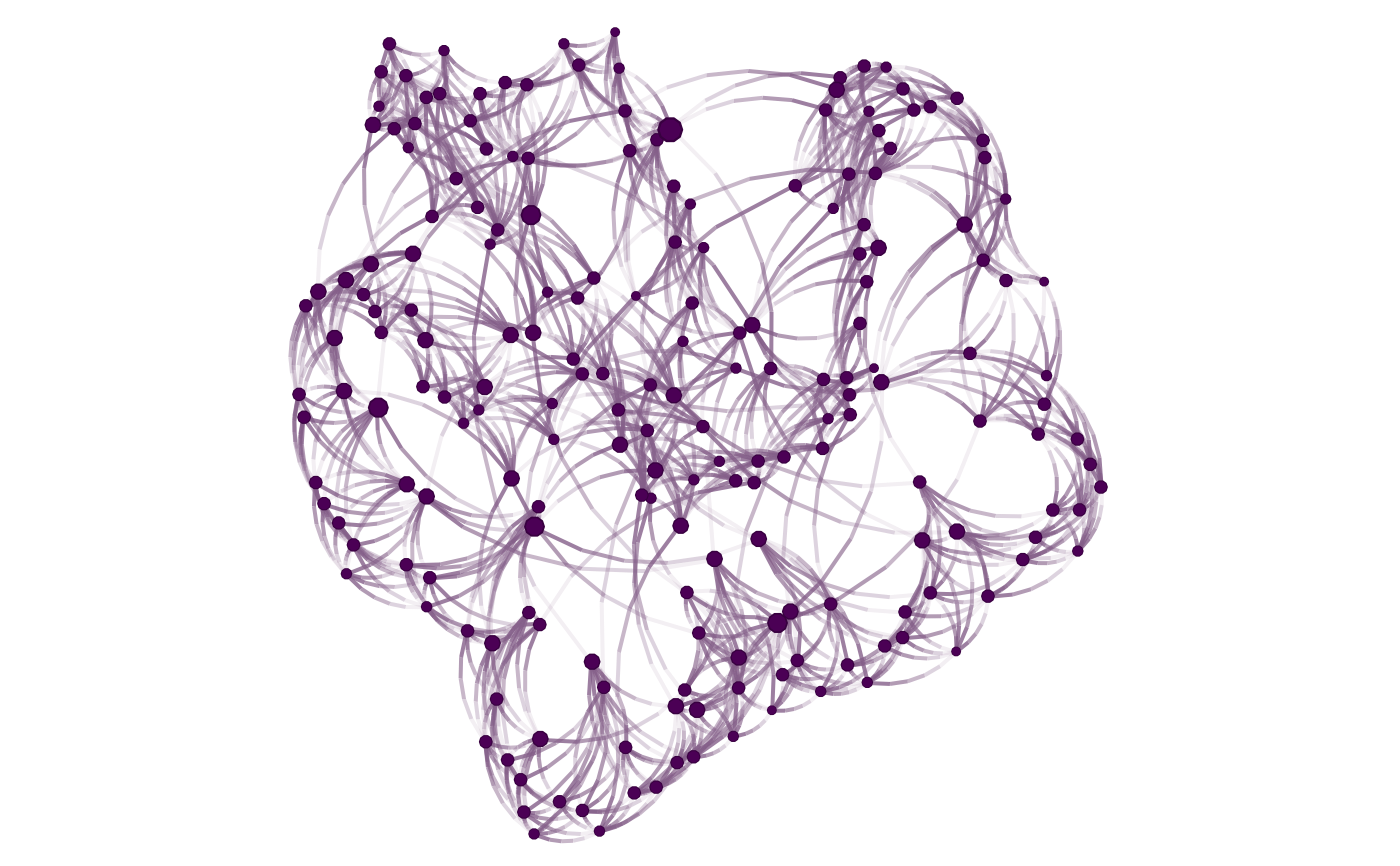
 nplot(x) # ala netplot
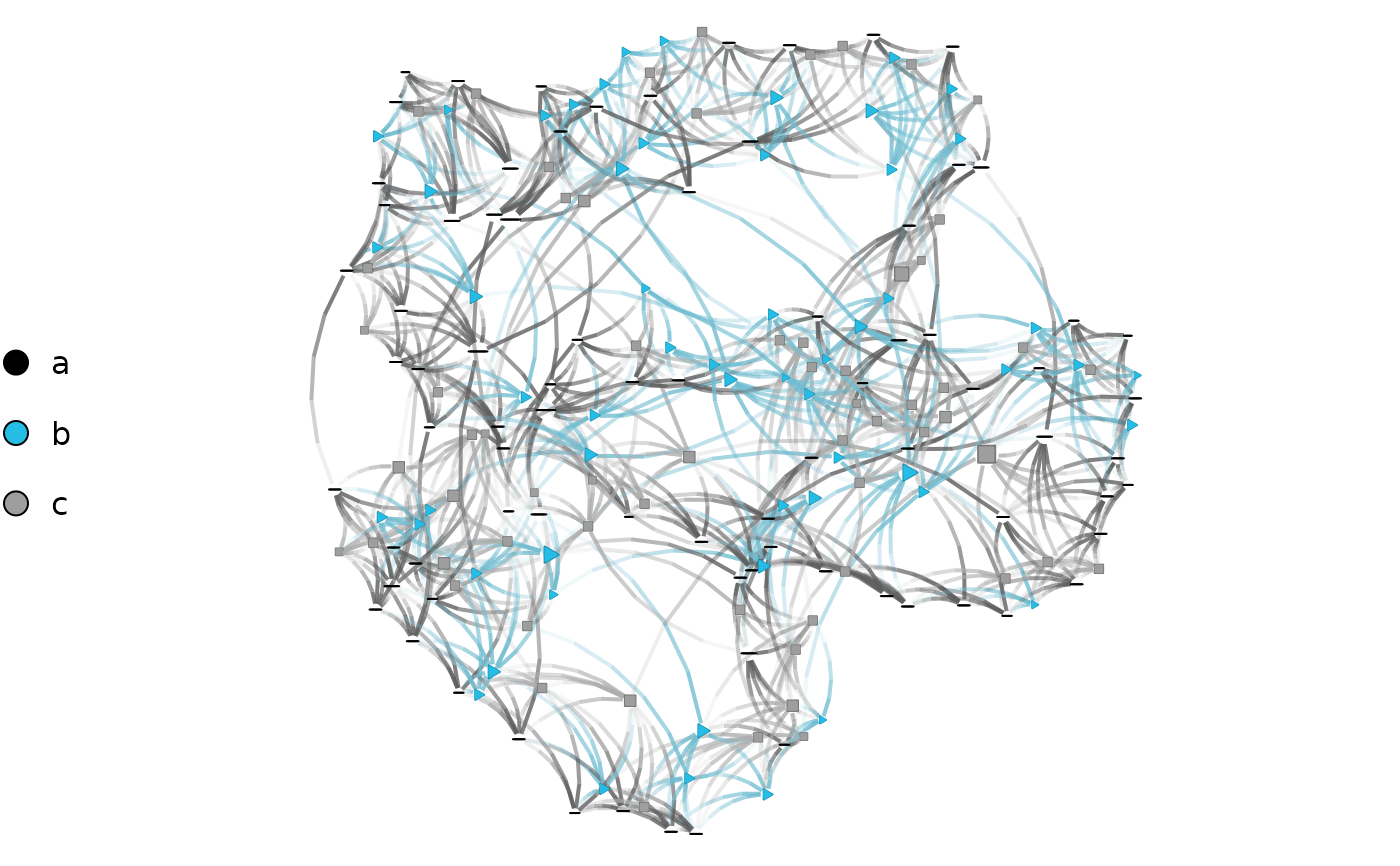
 # Mapping aesthetics from vertex attributes using formulas
V(x)$grp <- sample(letters[1:3], vcount(x), replace = TRUE)
V(x)$deg <- degree(x)
nplot(
x,
vertex.color = ~ grp, # color by the categorical attribute
vertex.nsides = ~ grp, # and give each group a distinct shape
vertex.size = ~ deg # size by a numeric attribute
)
# Mapping aesthetics from vertex attributes using formulas
V(x)$grp <- sample(letters[1:3], vcount(x), replace = TRUE)
V(x)$deg <- degree(x)
nplot(
x,
vertex.color = ~ grp, # color by the categorical attribute
vertex.nsides = ~ grp, # and give each group a distinct shape
vertex.size = ~ deg # size by a numeric attribute
)