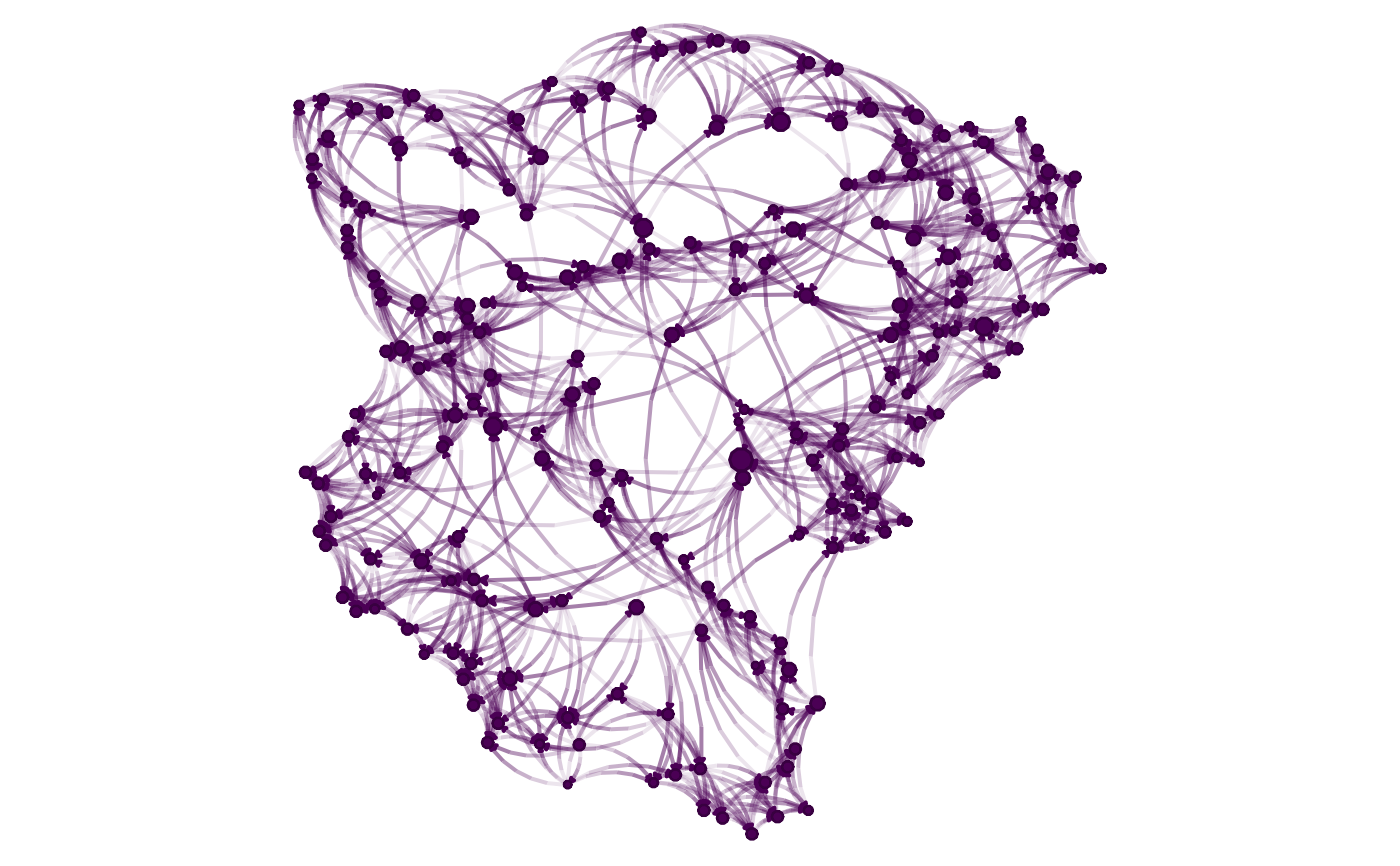
nplot using base graphics
Usage
nplot_base(
  x,
  layout = igraph::layout_nicely(x),
  vertex.size = igraph::degree(x, mode = "in"),
  bg.col = "transparent",
  vertex.nsides = 10,
  vertex.color = grDevices::hcl.colors(1),
  vertex.size.range = c(0.01, 0.03, 4),
  vertex.frame.color = grDevices::adjustcolor(vertex.color, red.f = 0.75, green.f = 0.75,
    blue.f = 0.75),
  vertex.rot = 0,
  vertex.frame.prop = 0.1,
  edge.width = NULL,
  edge.width.range = c(1, 2),
  edge.arrow.size = NULL,
  edge.color = NULL,
  edge.color.mix = 0.5,
  edge.color.alpha = c(0.1, 0.5),
  edge.curvature = pi/3,
  edge.line.lty = "solid",
  edge.line.breaks = 5,
  sample.edges = 1,
  skip.vertex = FALSE,
  skip.edges = FALSE,
  skip.arrows = skip.edges,
  add = FALSE,
  zero.margins = TRUE
)
Arguments
- x
A graph. It supports networks stored as
igraph,network, and matrices objects (see details).- layout
Numeric two-column matrix with the graph layout in x/y positions of the vertices.
- vertex.size
Numeric vector of length
vcount(x). Absolute size of the vertex from 0 to 1. Can also be a one-sided formula (e.g.~ degree) naming a numeric vertex attribute to map sizes from (see "Mapping attributes with formulas").- bg.col
Color of the background.
- vertex.nsides
Numeric vector of length
vcount(x). Number of sides of the vertex. E.g. three is a triangle, and 100 approximates a circle. Can also be a one-sided formula (e.g.~ group) naming a vertex attribute; each unique value is then mapped to a distinct shape (see "Mapping attributes with formulas").- vertex.color
Vector of length
vcount(x). Vertex HEX or built in colors. Can also be a one-sided formula (e.g.~ group) naming a vertex attribute to color vertices by (see "Mapping attributes with formulas").- vertex.size.range
Numeric vector of length 2 or 3, or
NULL. Relative size for the minimum and maximum of the plot, and curvature of the scale. The third number is used assize^rel[3]. IfNULL, scaling is suppressed andvertex.sizeis used as is.- vertex.frame.color
Vector of length
vcount(x). Border of vertex in HEX or built in colors.- vertex.rot
Vector of length
vcount(x)in Radians. Passed to npolygon, elevation degree from which the polygon is drawn.- vertex.frame.prop
Vector of length
vcount(x). What proportion of the vertex does the frame occupy (values between 0 and 1).- edge.width
Numeric vector of length
ecount(x). Relative edge widths. Values are normalized and then mapped to the range specified byedge.width.range, unlessedge.width.rangeisNULL. Fornplot.igraphandnplot.network, defaults to the "weight" edge attribute if present; otherwise all edges use width 1. Can also be a one-sided formula (e.g.~ weight) naming a numeric edge attribute (see "Mapping attributes with formulas").- edge.width.range
Numeric vector of length 2, or
NULL. The minimum and maximum line widths (in points) to use when mappingedge.widthvalues. For example,c(1, 4)maps the smallest edge weight to 1pt and the largest to 4pt. IfNULL, scaling is suppressed andedge.widthis used as is.- edge.arrow.size
Vector of length
ecount(x)from 0 to 1.- edge.color
A vector of length
ecount(x). In HEX or built in colors. Can beNULLin which case the color is picked as a mixture between ego and alters'vertex.colorvalues.- edge.color.mix
Proportion of the mixing.
- edge.color.alpha
Either a vector of length 1 or 2, or a matrix of size
ecount(x)*2with values in[0,1]. Alpha (transparency) levels (see details)- edge.curvature
Numeric vector of length
ecount(x). Curvature of edges in terms of radians.- edge.line.lty
Vector of length
ecount(x). Line types in R (e.g.- 1 = Solid, 2 = Dashed, etc).- edge.line.breaks
Vector of length
ecount(x). Number of vertices to draw (approximate) the arc (edge).- sample.edges
Numeric scalar between 0 and 1. Proportion of edges to sample.
- skip.vertex, skip.edges, skip.arrows
Logical scalar. When
TRUEthe object is not plotted.- add
Logical scalar.
- zero.margins
Logical scalar.
Value
nplot_base returns a list with the following components:
vertex.coordsA list of lengthNwhere each element describes the geomtry of each vertex.vertex.colorA vector of colorsvertex.frame.coordsSimilar tovertex.coords, but for the frame.vertex.frame.colorSimilar tovertex.color, but for the frame.edge.colorVector of functions used to compute the edge colors.edge.coordsSimilar tovertex.coords, the points that describe each edge.edge.arrow.coordsA list of matrices describing the geometry of the tip of the edges.edge.widthA numeric vector with edges' widths.xlim,ylimLimits of the plot area.