
Mapping aesthetics with formulas
George G. Vega Yon
2026-09-11
Source:vignettes/formulas.Rmd
formulas.RmdHow to cite. If you use netplot in published work, please cite it — run
citation("netplot")in R for the full entry.
One of the most convenient features of nplot() is that
many aesthetics can be mapped directly from graph
attributes using a one-sided formula, instead of building the
vector of colors, shapes, or sizes by hand. This vignette walks through
the different formula interfaces available in
netplot.
At a glance, nplot() understands two flavors of
formula:
| Aesthetic | Formula | What it does |
|---|---|---|
vertex.color |
~ attr |
Colors vertices by a vertex attribute (categorical, numeric, logical). |
vertex.nsides |
~ attr |
Maps each unique value of a vertex attribute to a distinct shape. |
vertex.size |
~ attr |
Scales vertex sizes from a numeric vertex attribute. |
edge.width |
~ attr |
Scales edge widths from a numeric edge attribute. |
edge.color |
~ ego(...) + alter(...) |
Blends edge colors from the two endpoints (see the last section). |
A working example
We will use the UKfaculty network from the
igraphdata package, a friendship network among faculty
at a UK university. It already carries a Group vertex
attribute (the school/department each person belongs to).
data("UKfaculty", package = "igraphdata")

set.seed(225)
l <- layout_with_fr(UKfaculty)

# A couple of extra attributes to play with. We qualify igraph::degree()
# explicitly because other packages (e.g. sna) also define a degree().
V(UKfaculty)$indeg  <- igraph::degree(UKfaculty, mode = "in")
V(UKfaculty)$is_hub <- V(UKfaculty)$indeg > stats::median(V(UKfaculty)$indeg)
Coloring vertices: vertex.color = ~ attr
Passing vertex.color = ~ Group colors each vertex
according to its Group attribute. netplot detects the type
of the attribute and picks a sensible scale automatically:
- character / factor attributes are mapped to a categorical palette,
- numeric attributes to a continuous gradient, and
- logical attributes to two contrasting colors.
When you print a plot built this way, netplot also draws a matching legend.
nplot(UKfaculty, layout = l, vertex.color = ~ Group)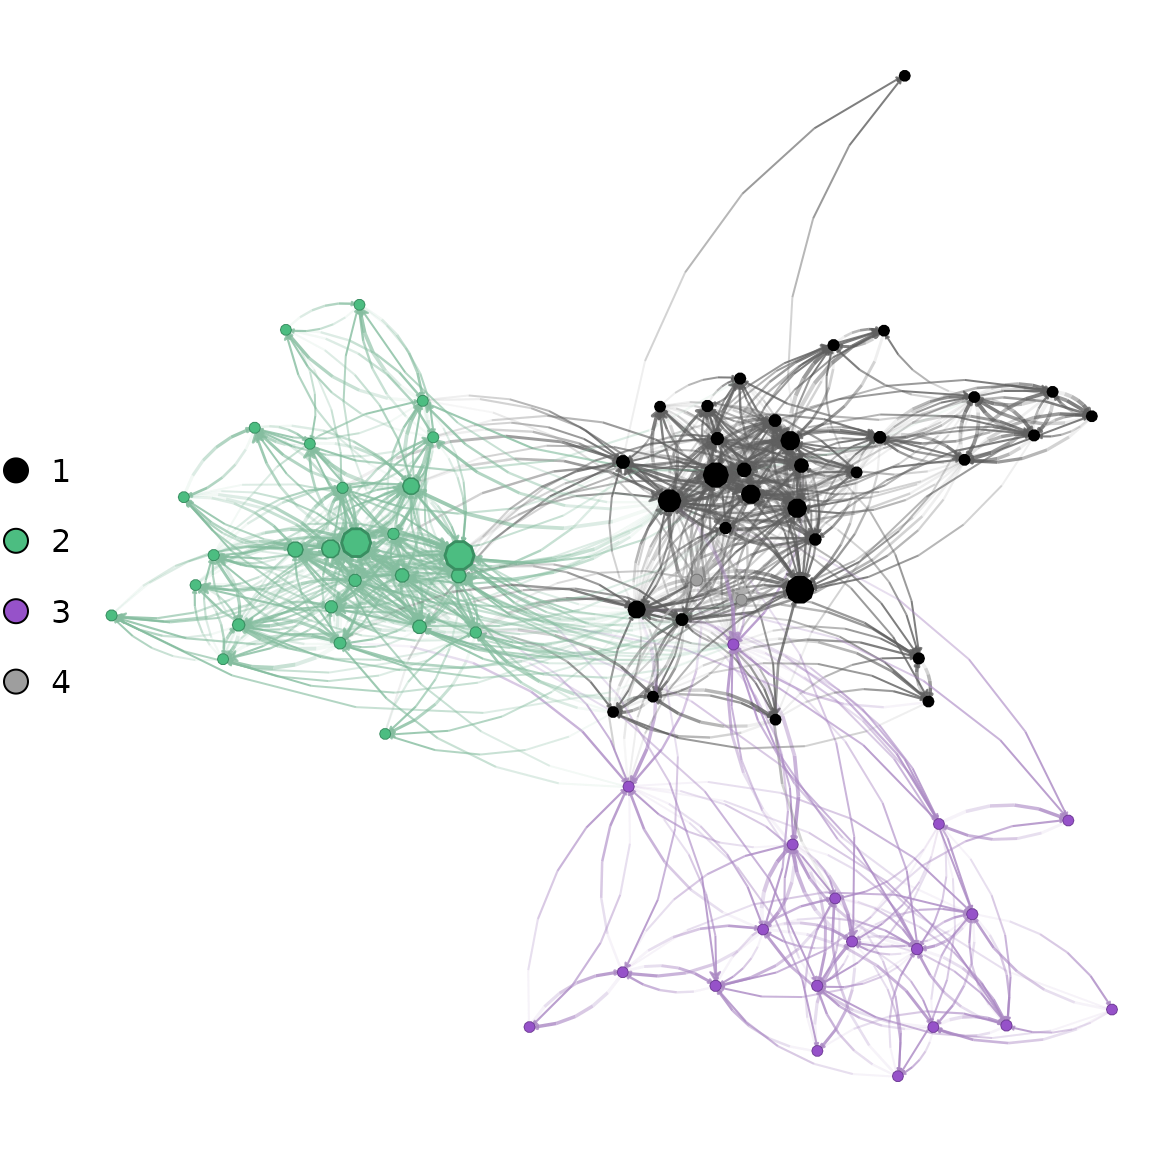
Vertices colored by the categorical Group attribute, with
an automatic legend.
The same syntax works for a numeric attribute, in which case a continuous color gradient is used. netplot detects that the attribute is continuous and draws a color bar (rather than a set of discrete keys) as the legend:
nplot(UKfaculty, layout = l, vertex.color = ~ indeg)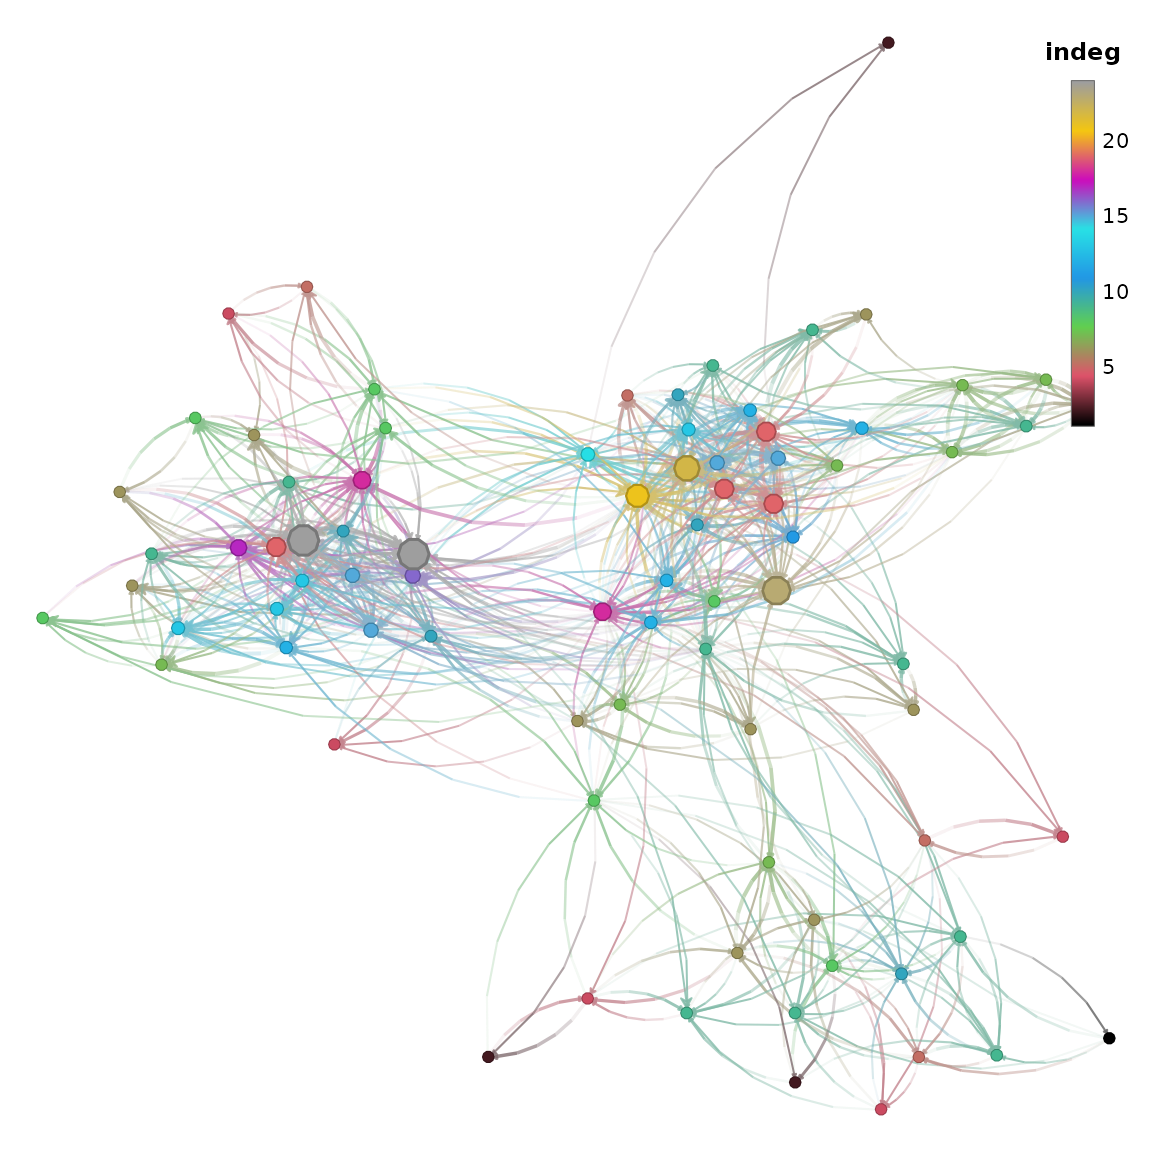
Vertices colored by in-degree (a numeric attribute) using a continuous gradient, with a color-bar legend.
And for a logical attribute, mapping the two values to two colors:
nplot(UKfaculty, layout = l, vertex.color = ~ is_hub)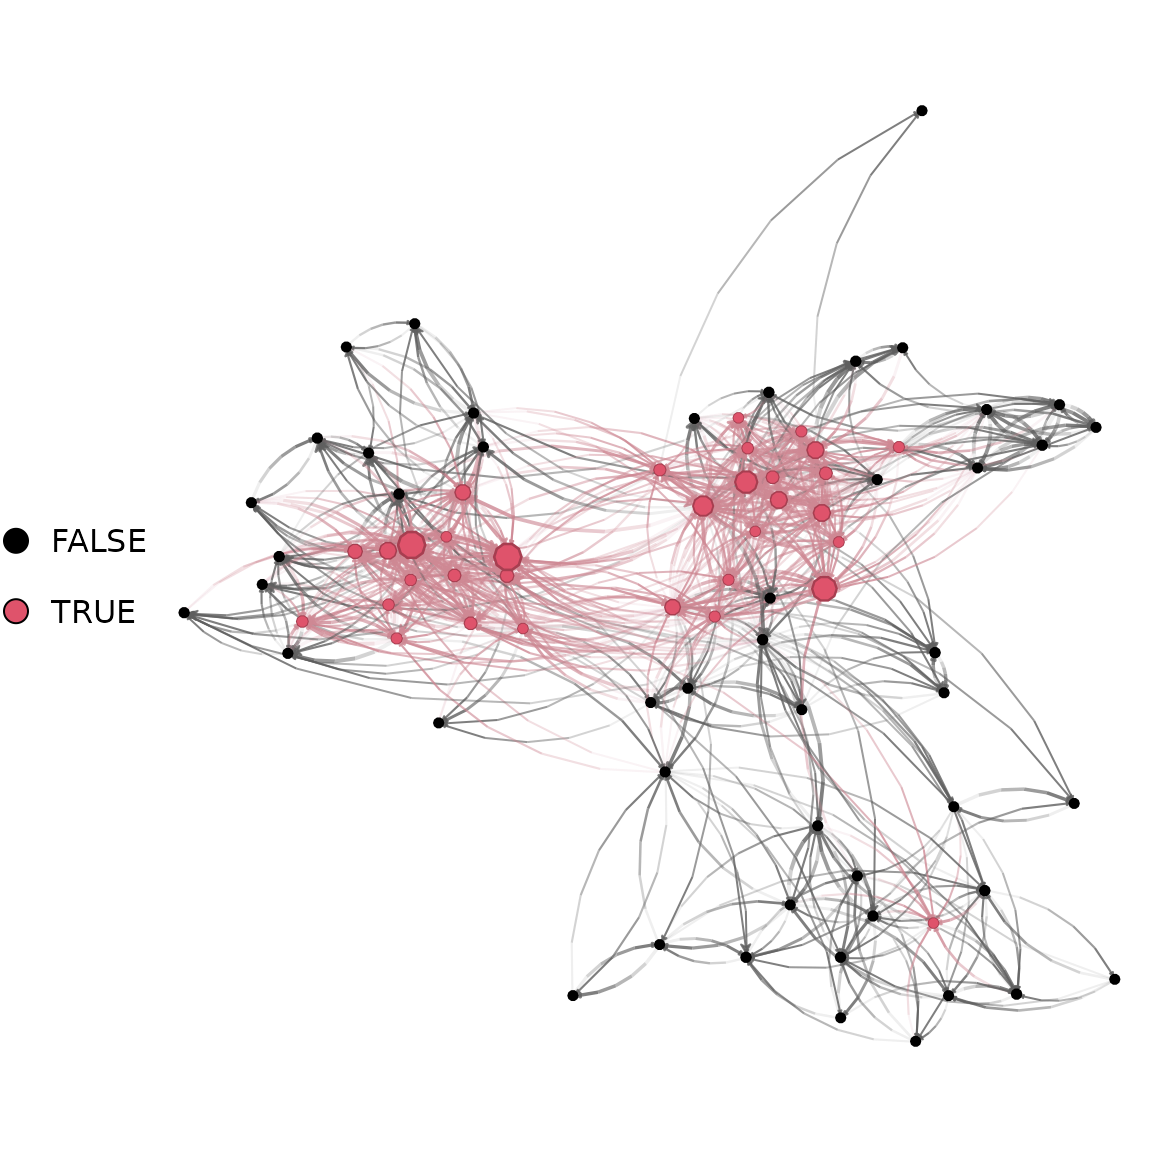
Vertices colored by a logical attribute (hub vs. non-hub).
Shaping vertices: vertex.nsides = ~ attr
vertex.nsides controls the number of sides of each
vertex polygon (3 = a triangle, 4 = a square, and larger numbers
approximate a circle). Passing a formula maps every unique value of the
attribute to a distinct shape, which is handy for
encoding a second categorical variable alongside color:
nplot(
  UKfaculty,
  layout        = l,
  vertex.color  = ~ Group,
  vertex.nsides = ~ Group
)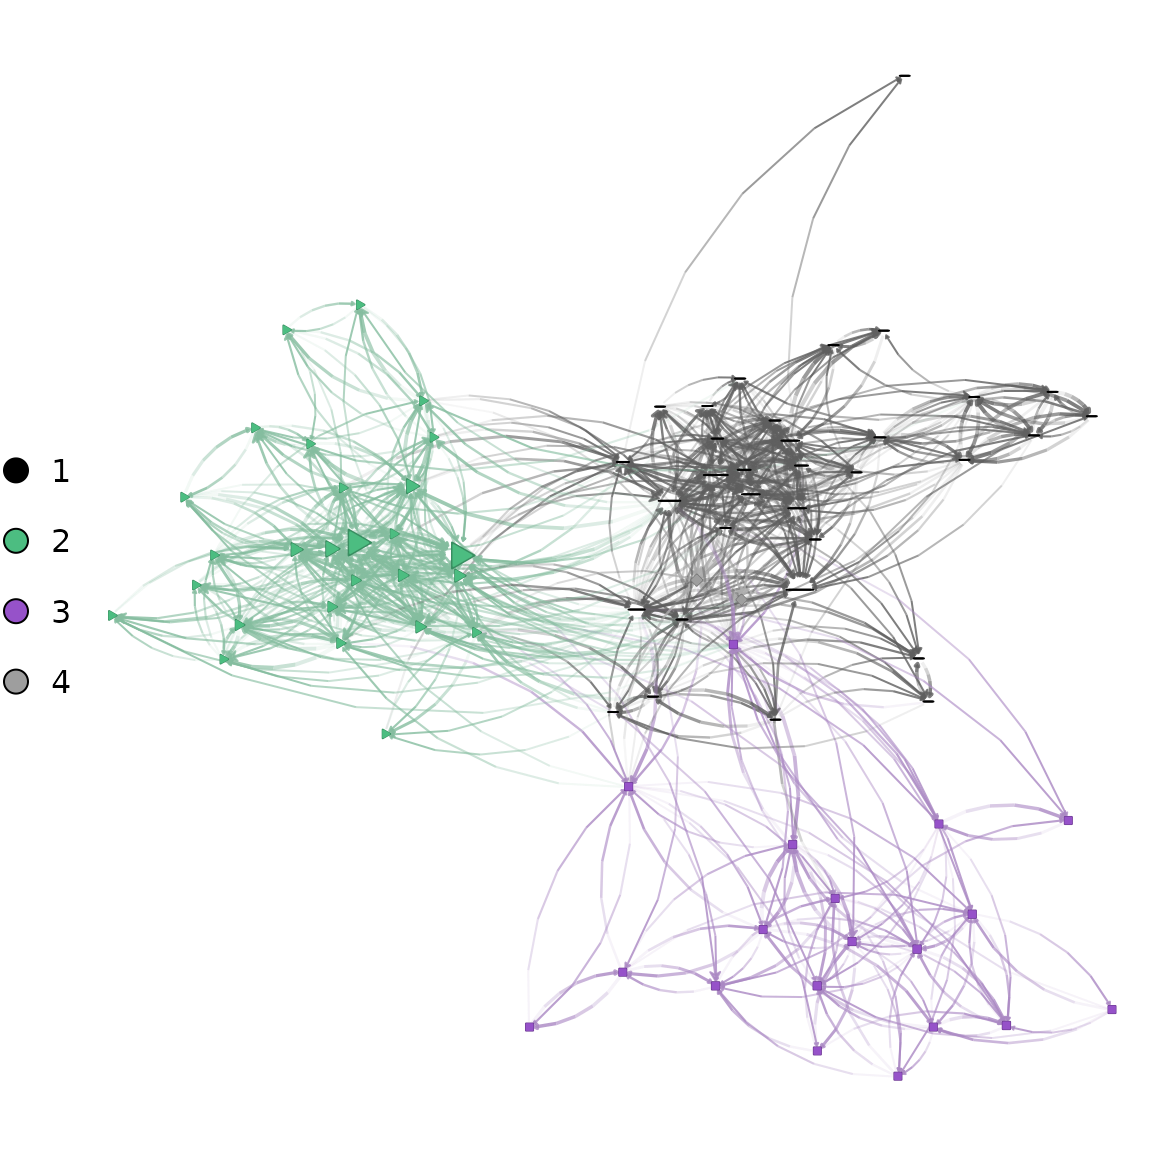
Vertex color and shape mapped from the same Group
attribute.
Because each group gets both a color and a shape, the figure stays readable even when printed in grayscale.
Sizing vertices: vertex.size = ~ attr
vertex.size accepts a formula naming a
numeric vertex attribute. Values are rescaled to the
range given by vertex.size.range, so more central actors
show up as larger nodes:
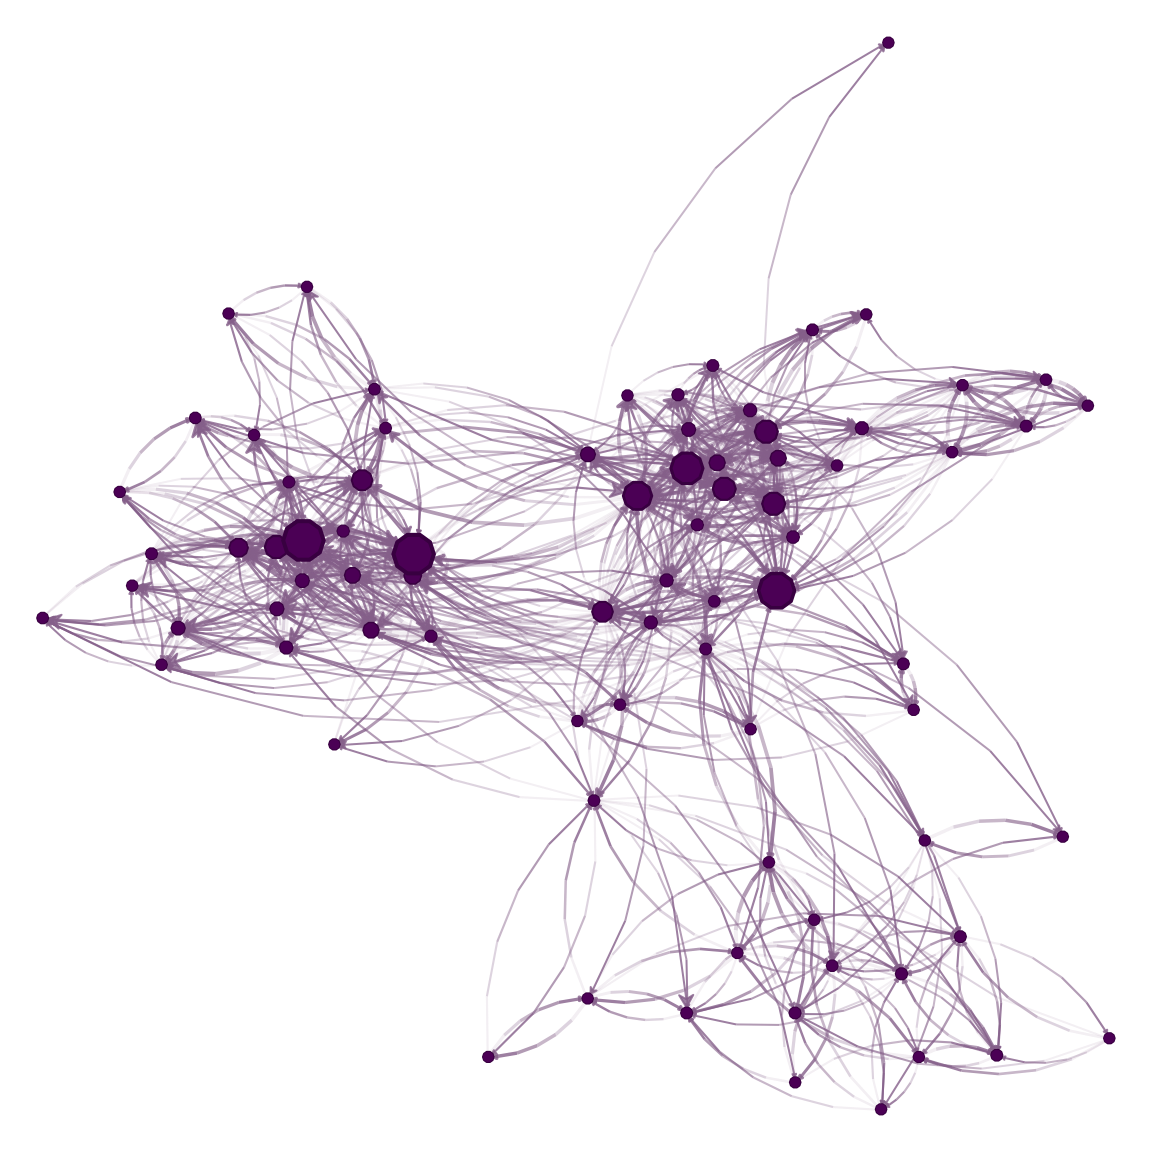
Vertex size mapped from in-degree.
Putting it together
The formula interfaces compose, so a single nplot() call
can encode several variables at once — color, shape, and size — with
very little code:
nplot(
  UKfaculty,
  layout            = l,
  vertex.color      = ~ Group,   # color by department
  vertex.nsides     = ~ Group,   # distinct shape per department
  vertex.size       = ~ indeg,   # size by popularity (in-degree)
  vertex.size.range = c(.01, .04, 4)
)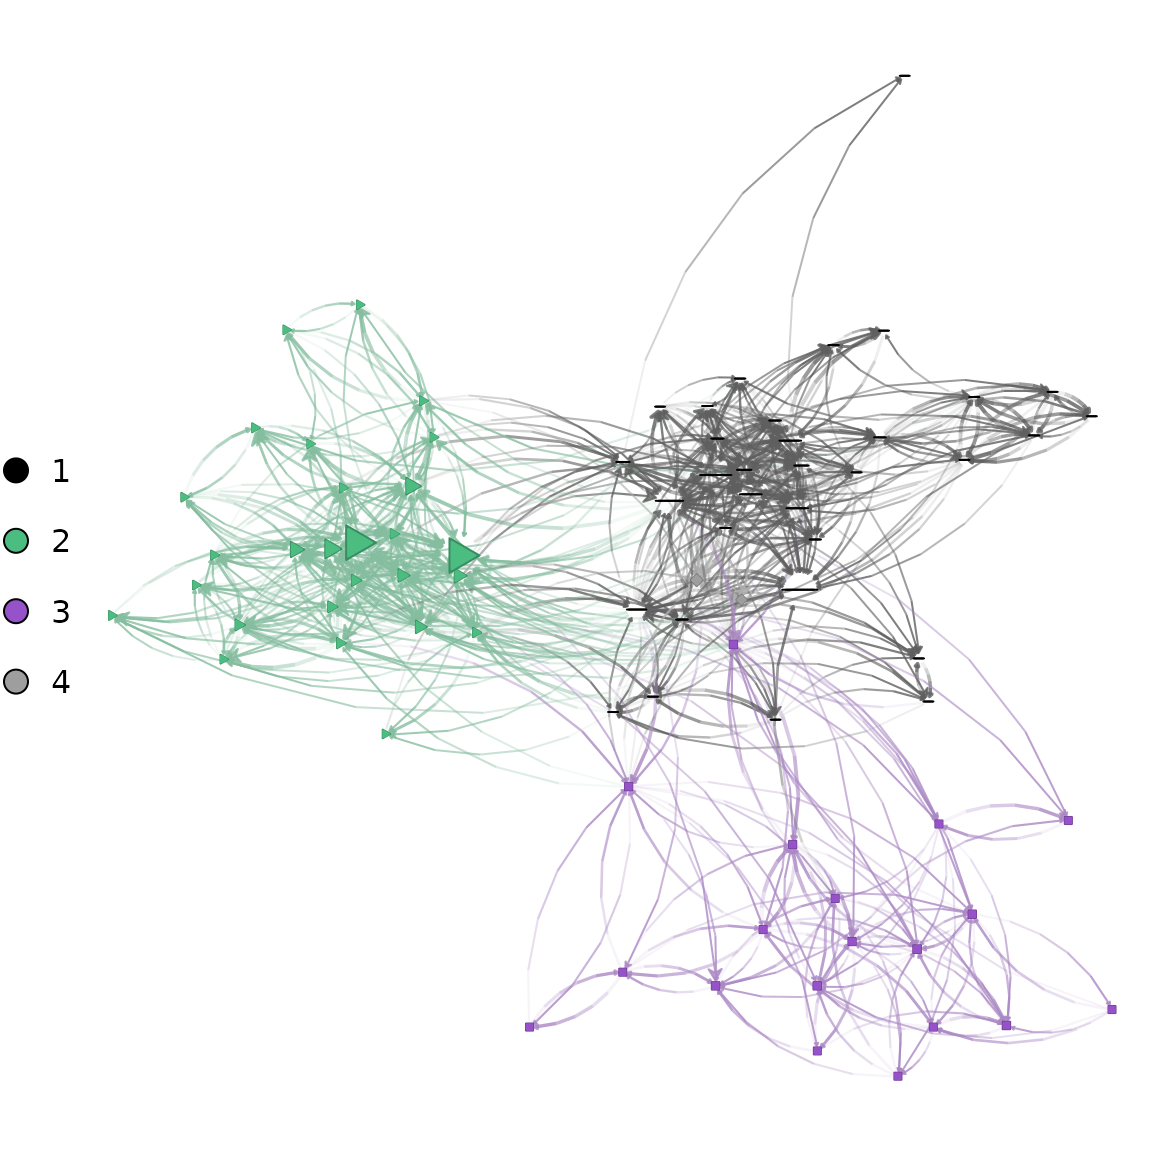
Color, shape, and size all mapped from graph attributes in a single call.
Scaling edges: edge.width = ~ attr
Edges have their own numeric attributes too.
edge.width = ~ attr scales edge widths from a numeric
edge attribute; the values are normalized and mapped to
edge.width.range. Here we use the friendship
weight:
nplot(
  UKfaculty,
  layout           = l,
  edge.width       = ~ weight,
  edge.width.range = c(1, 4, 4),
  skip.arrows      = TRUE
)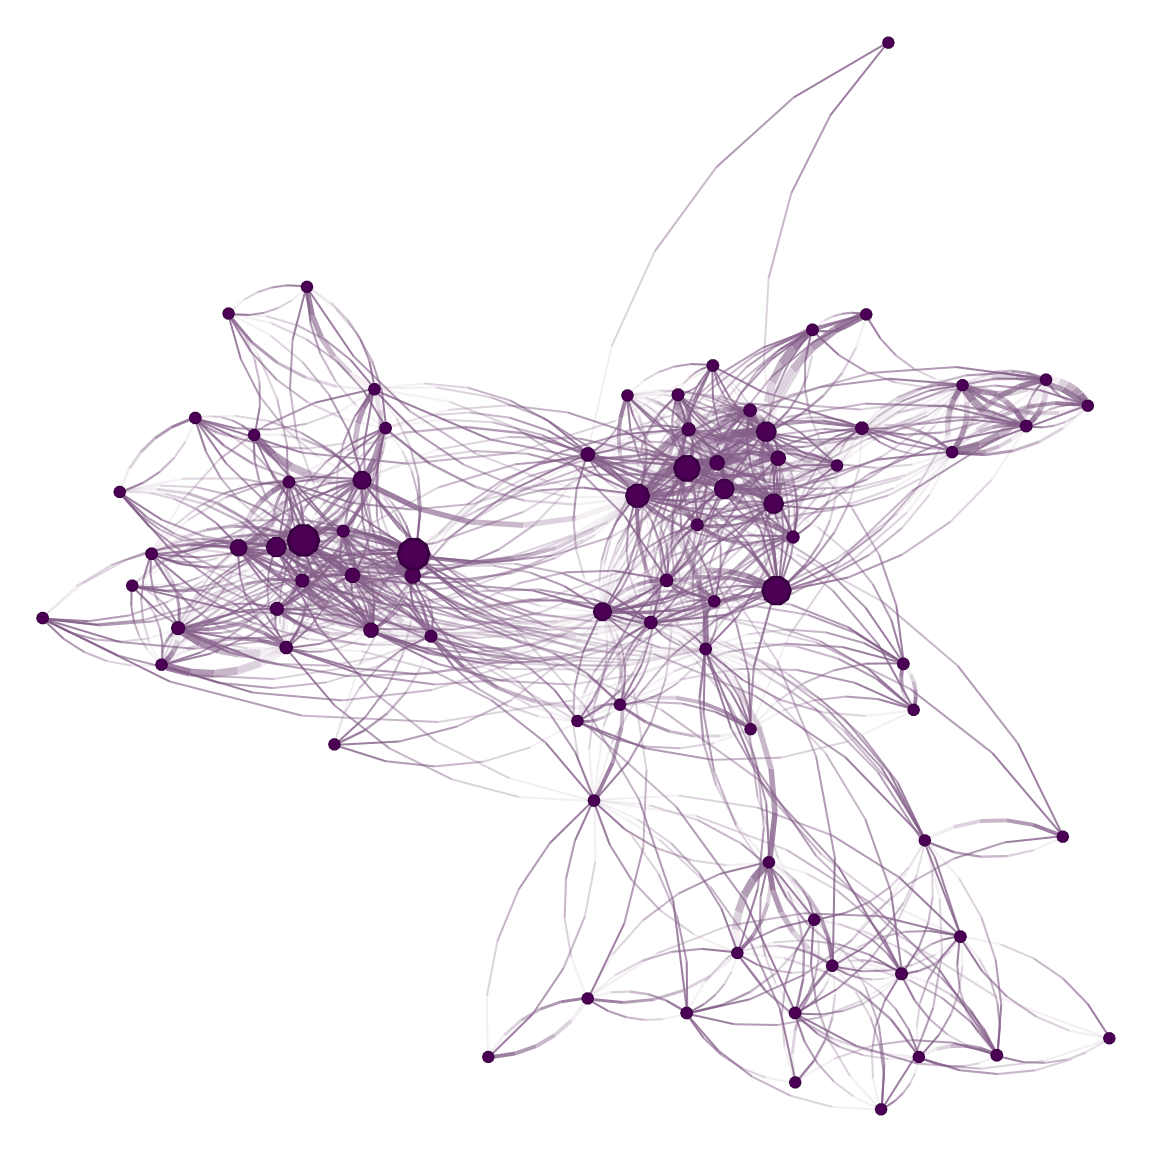
Edge width mapped from the numeric weight edge attribute.
For vertex.nsides, vertex.size, and
edge.width, the right-hand side of the formula is
evaluated with the graph’s attributes in scope, so you are not
limited to bare attribute names — expressions work too, e.g.
edge.width = ~ log1p(weight) or
vertex.size = ~ degree ^ 2.
Coloring edges:
edge.color = ~ ego(...) + alter(...)
Edge colors use a richer, dedicated grammar built from two special terms:
Each term borrows its color from the corresponding endpoint’s
vertex.color (unless you pass an explicit
col), and each accepts three tweaks:
-
col— the base color, -
alpha— transparency, from 0 (transparent) to 1 (opaque), and -
mix— how much weight that endpoint contributes when the two colors are blended along the edge.
The default, ~ ego(alpha = .1, col = "gray") + alter,
fades each edge from a faint gray at the source to the target’s color.
The panels below vary mix to shift the blend from alter
only to ego only:
gridExtra::grid.arrange(
  nplot(UKfaculty, layout = l, vertex.color = ~ Group,
        edge.color = ~ ego(mix = 0, alpha = .1) + alter(mix = 1)),
  nplot(UKfaculty, layout = l, vertex.color = ~ Group,
        edge.color = ~ ego(mix = .5, alpha = .1) + alter(mix = .5)),
  nplot(UKfaculty, layout = l, vertex.color = ~ Group,
        edge.color = ~ ego(mix = 1, alpha = .1) + alter(mix = 0)),
  ncol = 3
)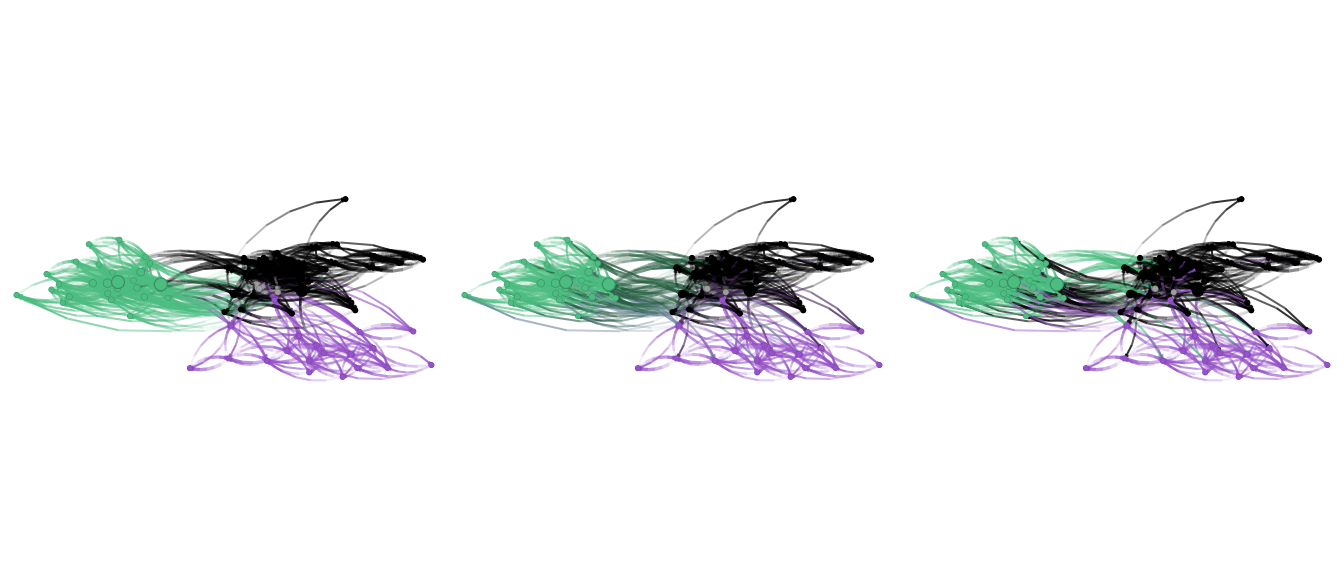
Varying the mix between ego and
alter in the edge color formula. Left: alter only. Middle:
an even blend. Right: ego only.
Applying formulas after the fact
The attribute-mapping formulas for vertex color also work with
set_vertex_gpar(), so you can recolor an existing plot
without rebuilding it:
np <- nplot(UKfaculty, layout = l)

set_vertex_gpar(np, element = "core", fill = ~ Group)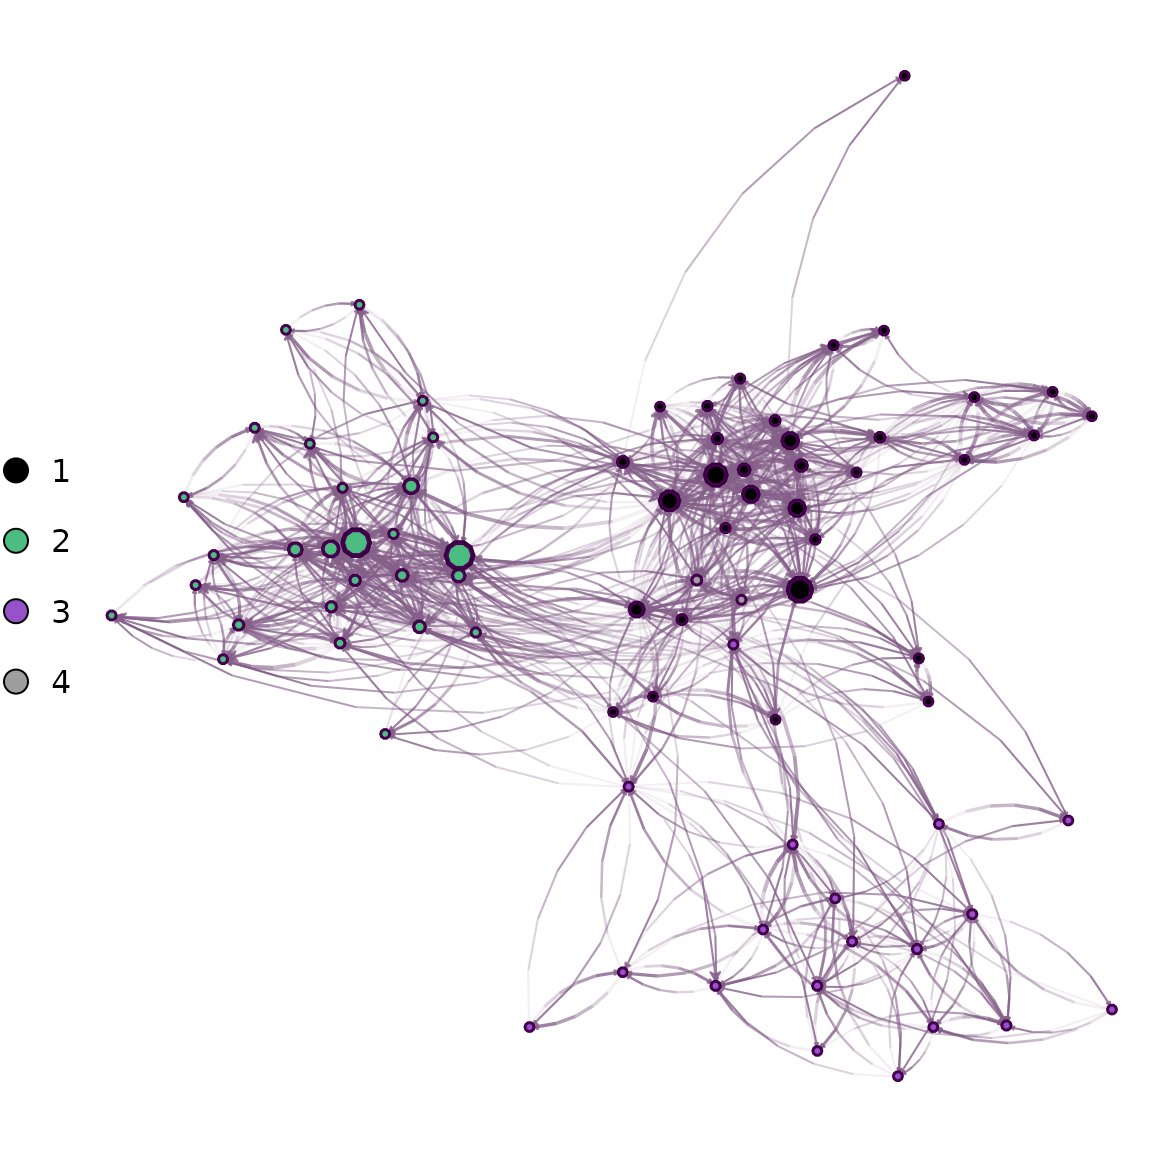
Recoloring an existing plot by attribute using
set_vertex_gpar().
Summary
- Use
vertex.color = ~ attrto color vertices by an attribute (with an automatic legend),vertex.nsides = ~ attrto give each category a shape, andvertex.size = ~ attr/edge.width = ~ attrto scale sizes and widths from numeric attributes. - Use
edge.color = ~ ego(...) + alter(...)to blend edge colors from their endpoints; see?\netplot-formulae`` for the full grammar. - All of these compose, letting a single
nplot()call encode several variables at once. ```