Implementes the algorithm described in Valente and Davis (1999)
mentor_matching(
  graph,
  n,
  cmode = "indegree",
  lead.ties.method = "average",
  geodist.args = list()
)

leader_matching(
  graph,
  n,
  cmode = "indegree",
  lead.ties.method = "average",
  geodist.args = list()
)

# S3 method for class 'diffnet_mentor'
plot(
  x,
  y = NULL,
  vertex.size = "degree",
  minmax.relative.size = getOption("diffnet.minmax.relative.size", c(0.01, 0.04)),
  lead.cols = grDevices::topo.colors(attr(x, "nleaders")),
  vshapes = c(Leader = "square", Follower = "circle"),
  add.legend = TRUE,
  main = "Mentoring Network",
  ...
)
Arguments
- graph
Any class of accepted graph format (see
netdiffuseR-graphs).- n
Number of leaders
- cmode
Passed to
dgr.- lead.ties.method
Passed to
rank- geodist.args
Passed to
approx_geodesic.- x
An object of class
diffnet_mentor.- y
Ignored.
- vertex.size
Either a numeric scalar or vector of size \(n\), or any of the following values: "indegree", "degree", or "outdegree" (see details).
- minmax.relative.size
Passed to
rescale_vertex_igraph.- lead.cols
Character vector of length
attr(x,"nleaders"). Colors to be applied to each group. (see details)- vshapes
Character scalar of length 2. Shapes to identify leaders (mentors) and followers respectively.
- add.legend
Logical scalar. When
TRUEgenerates a legend to distinguish between leaders and followers.- main
Character scalar. Passed to
title- ...
Further arguments passed to
plot.igraph
Value
An object of class diffnet_mentor and data.frame with the following columns:
- name
Character. Labels of the vertices
- degree
Numeric. Degree of each vertex in the graph
- iselader
Logical.
TRUEwhen the vertex was picked as a leader.- match
Character. The corresponding matched leader.
The object also contains the following attributes:
- nleaders
Integer scalar. The resulting number of leaders (could be greater than
n)
.
- graph
The original graph used to run the algorithm.
Details
The algorithm works as follows:
Find the top
nindividuals ranking them bydgr(graph, cmode). The rank is computed by the functionrank. Denote this setM.Compute the geodesic matrix.
For each
v in Vdo:Find the mentor
m in Msuch that is closest tovWere there a tie, choose the mentor that minimizes the average path length from
v's direct neighbors tom.If there are no paths to any member of
M, or all have the same average path length tov's neighbors, then assign one randomly.
Plotting is done via the function plot.igraph.
When vertex.size is either of "degree", "indegree", or
"outdegree", vertex.size will be replace with dgr(.,cmode = )
so that the vertex size reflects the desired degree.
The argument minmax.relative.size is passed to rescale_vertex_igraph
which adjusts vertex.size so that the largest and smallest vertices
have a relative size of minmax.relative.size[2] and
minmax.relative.size[1] respectively with respect to the x-axis.
References
Valente, T. W., & Davis, R. L. (1999). Accelerating the Diffusion of Innovations Using Opinion Leaders. The ANNALS of the American Academy of Political and Social Science, 566(1), 55–67. doi:10.1177/000271629956600105
Examples
# A simple example ----------------------------------------------------------
set.seed(1231)
graph <- rgraph_ws(n=50, k = 4, p = .5)

# Looking for 3 mentors
ans <- mentor_matching(graph, n = 3)

head(ans)
#>   name degree isleader match
#> 1    1      4    FALSE    49
#> 2    2      2    FALSE    17
#> 3    3      2    FALSE    22
#> 4    4      3    FALSE    20
#> 5    5      3    FALSE     6
#> 6    6      6     TRUE     6
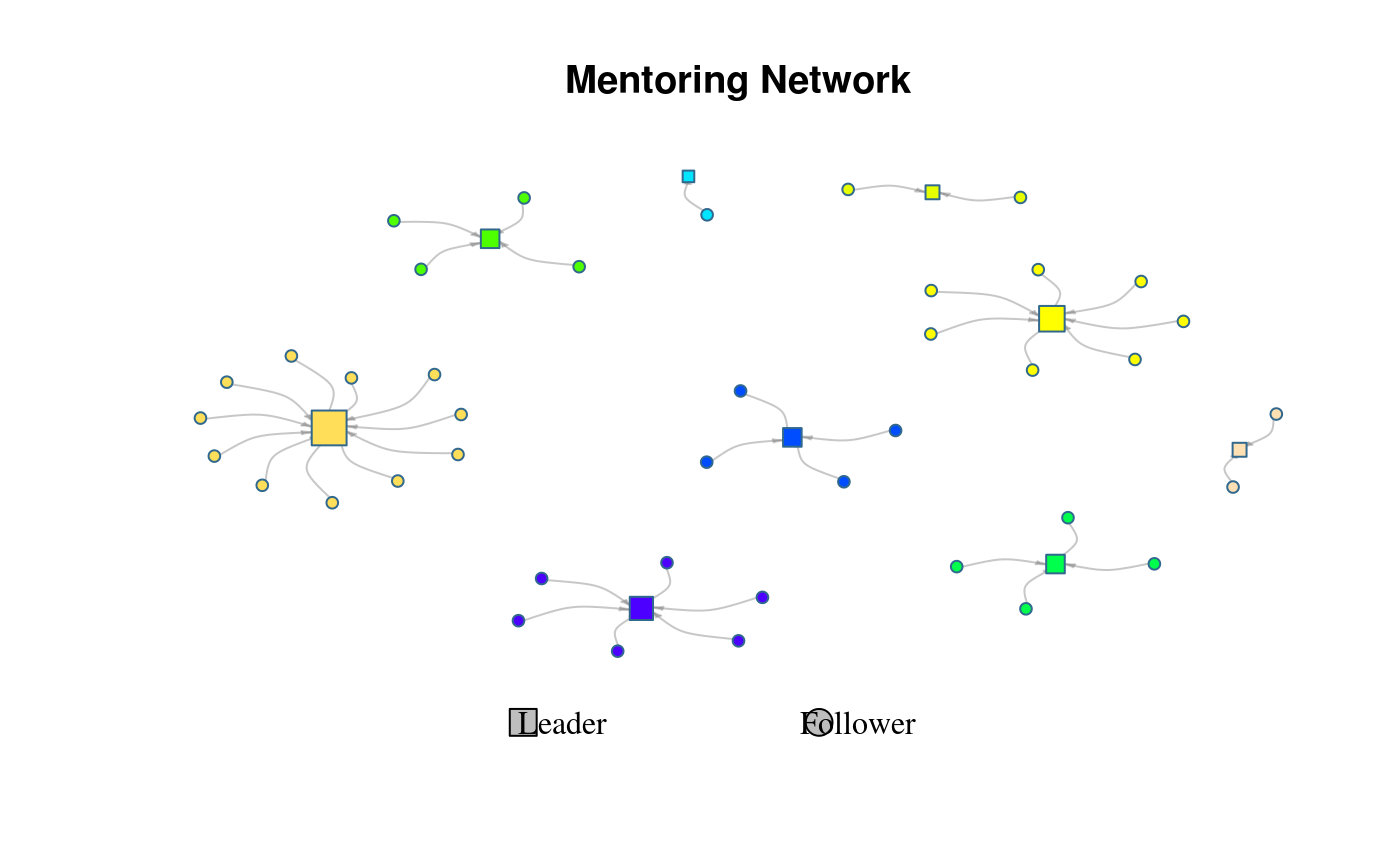
table(ans$match) # We actually got 9 b/c of ties
#>
#> 15 17 20 22 33 43 49  6  9
#>  7  5  2  5  5  3  8 12  3

# Visualizing the mentor network
plot(ans)
