This function rescales a vertex size before passing it to
plot.igraph so that the resulting vertices
have the desired size relative to the x-axis.
rescale_vertex_igraph(
  vertex.size,
  par.usr = par("usr"),
  minmax.relative.size = getOption("diffnet.minmax.relative.size", c(0.01, 0.04)),
  adjust = 200
)

igraph_vertex_rescale(
  vertex.size,
  par.usr = par("usr"),
  minmax.relative.size = getOption("diffnet.minmax.relative.size", c(0.01, 0.04)),
  adjust = 200
)

vertex_rescale_igraph(
  vertex.size,
  par.usr = par("usr"),
  minmax.relative.size = getOption("diffnet.minmax.relative.size", c(0.01, 0.04)),
  adjust = 200
)
Arguments
- vertex.size
Numeric vector of unscaled vertices' sizes. This is unit-free.
- par.usr
Integer vector of length 4 with the coordinates of plotting region. by default uses
par("usr").- minmax.relative.size
A numeric vector of length 2. Represents the desired min and max vertex sizes relative to the x-axis in terms of percentage (see details).
- adjust
Numeric scalar. Adjustment made to the resulting adjusted size (see details).
Value
An integer vector of the same length as vertex.size with
rescaled values.
Details
minmax.relative.size limits the minimum and maximum size that a vertex
can take in the plot relative to the x-axis scale. The values for the x-axis
scale are by default retrieved by accessing to par("usr"). By default
the vertex are rescaled to be at least 1% of the size of the plotting region
and no more than 5% of the plotting region, minmax.relative.size=c(.01, .05).
The default value for adjust is taken from igraph
version 1.0.1. In particular, the function igraph:::.igraph.shape.circle.plot,
in which before passing the vertex.size to the function
symbols, the vertex size is reduced by 200.
The rescaling is as follows: $$% v' = \frac{v - \underbar v}{\bar v - \underbar v}\times (\bar s - \underbar s) + \underbar s $$
Where \(v\) is the vertex size, \(\bar v\) and \(\underbar v\) are
the max and min values of \(v\) respectively, and \(\bar s\) and
\(\underbar s\) are the max and min size that vertices take in terms
of minmax.relative.size and par.usr. The adjusted value \(v'\)
is then multiplied by adjust.
igraph_vertex_rescale and vertex_rescale_igraph are aliases.
See also
Other visualizations:
dgr(),
diffusionMap(),
drawColorKey(),
grid_distribution(),
hazard_rate(),
plot_adopters(),
plot_diffnet(),
plot_diffnet2(),
plot_infectsuscep(),
plot_threshold()
Examples
library(igraph)
#>
#> Attaching package: ‘igraph’
#> The following objects are masked from ‘package:ape’:
#>
#> degree, edges, mst, ring
#> The following objects are masked from ‘package:sna’:
#>
#> betweenness, bonpow, closeness, components, degree, dyad.census,
#> evcent, hierarchy, is.connected, neighborhood, triad.census
#> The following objects are masked from ‘package:network’:
#>
#> %c%, %s%, add.edges, add.vertices, delete.edges, delete.vertices,
#> get.edge.attribute, get.edges, get.vertex.attribute, is.bipartite,
#> is.directed, list.edge.attributes, list.vertex.attributes,
#> set.edge.attribute, set.vertex.attribute
#> The following objects are masked from ‘package:stats’:
#>
#> decompose, spectrum
#> The following object is masked from ‘package:base’:
#>
#> union
# Random graph and coordinates
set.seed(2134)
g <- barabasi.game(10)
#> Warning: `barabasi.game()` was deprecated in igraph 2.0.0.
#> ℹ Please use `sample_pa()` instead.
coords <- layout_nicely(g)
# Random size and figures
size <- runif(10)
size <- cbind(size, size)
shap <- sample(c("circle", "square"),10,TRUE)
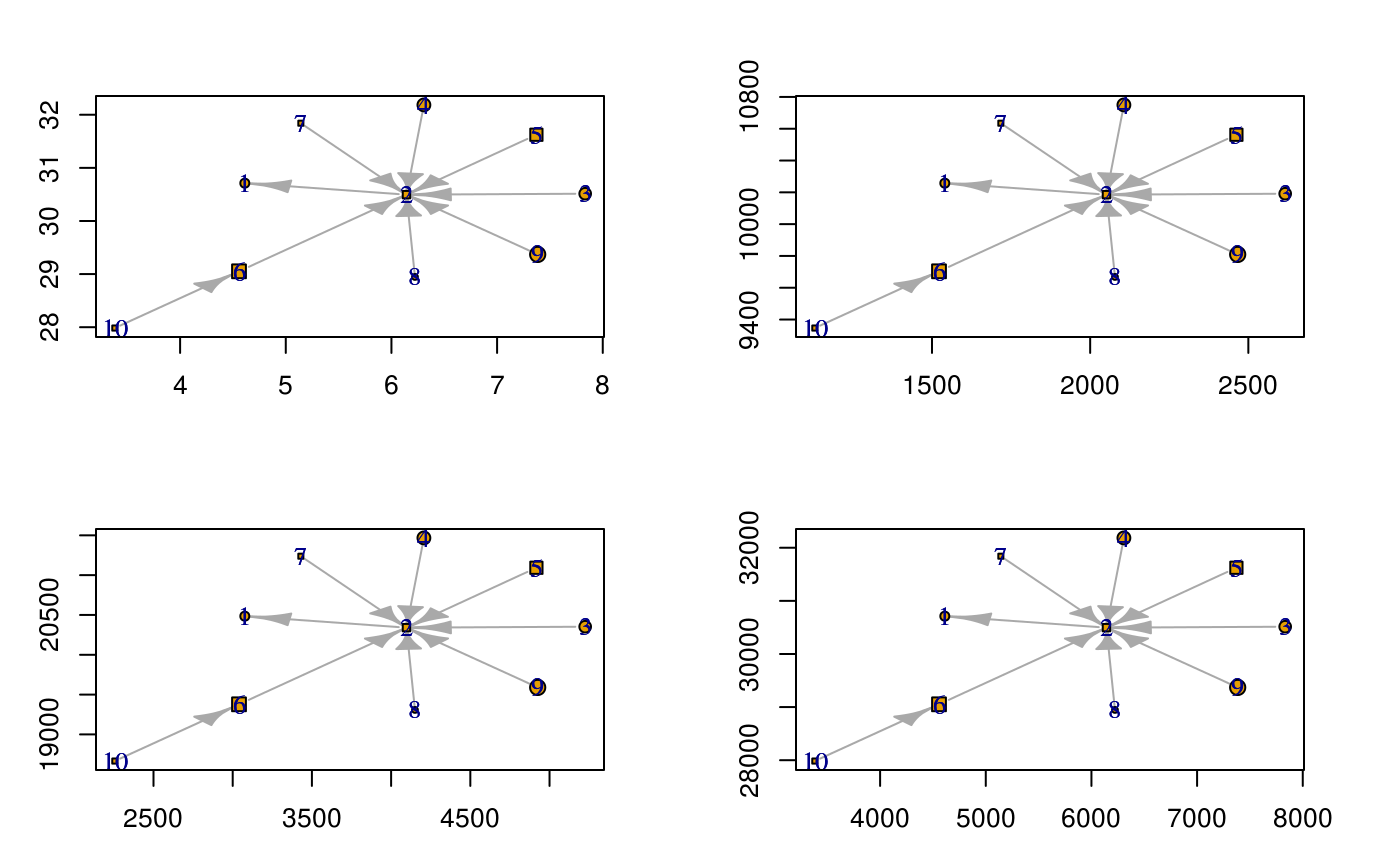
# Plotting
oldpar <- par(no.readonly = TRUE)
par(mfrow=c(2,2), mai=rep(.5,4))
for (i in seq(1, 1000, length.out = 4)) {
# New plot-window
plot.new()
plot.window(xlim=range(coords[,1]*i), ylim=range(coords[,2]*i))
# plotting graph
plot(g, layout=coords*i, add=TRUE, rescale=FALSE,
vertex.shape = shap,
vertex.size = rescale_vertex_igraph(size) # HERE WE RESCALE!
)
# Adding some axis
axis(1, lwd=0, lwd.ticks = 1)
axis(2, lwd=0, lwd.ticks = 1)
box()
}
 par(oldpar)