S3 plotting method for diffnet objects.
Arguments
- x
An object of class
diffnet- y
Ignored.
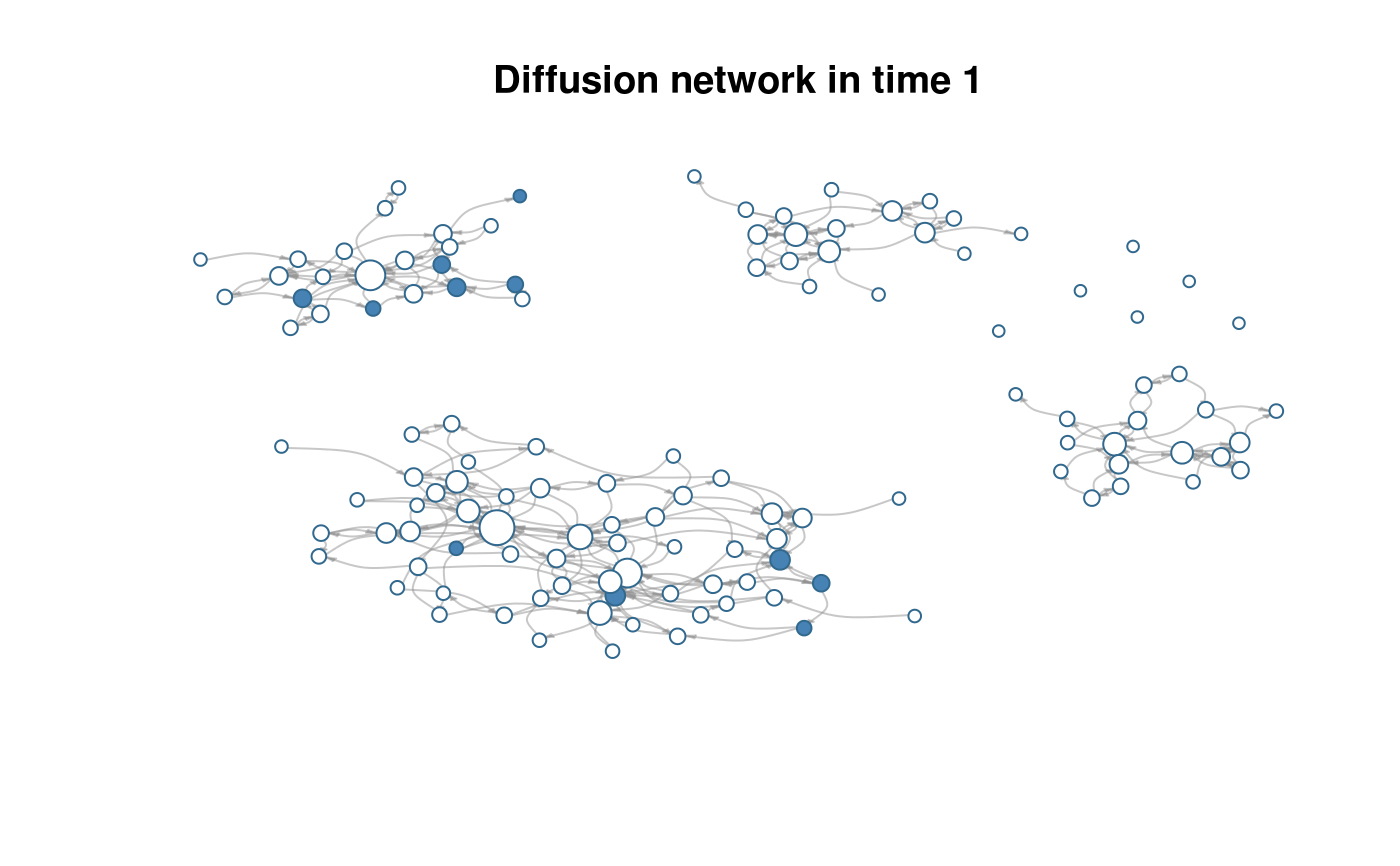
- t
Integer scalar indicating the time slice to plot.
- vertex.color
Character scalar/vector. Color of the vertices.
- vertex.size
Either a numeric scalar or vector of size \(n\), or any of the following values: "indegree", "degree", or "outdegree" (see details).
- main
Character. A title template to be passed to sprintf.
- minmax.relative.size
Passed to
rescale_vertex_igraph.- ...
Further arguments passed to
plot.igraph.
Value
A matrix with the coordinates of the vertices.
Details
Plotting is done via the function plot.igraph.
When vertex.size is either of "degree", "indegree", or
"outdegree", vertex.size will be replace with dgr(.,cmode = )
so that the vertex size reflects the desired degree.
The argument minmax.relative.size is passed to rescale_vertex_igraph
which adjusts vertex.size so that the largest and smallest vertices
have a relative size of minmax.relative.size[2] and
minmax.relative.size[1] respectively with respect to the x-axis.
See also
Other diffnet methods:
%*%(),
as.array.diffnet(),
c.diffnet(),
diffnet-arithmetic,
diffnet-class,
diffnet_index,
summary.diffnet()