diffnet objects contain diffusion networks. With adjacency
matrices and time of adoption (toa) vector (or matrix, for multiple behavior diffusion),
as its main components, most of the package's functions have methods for this class of objects.
as_diffnet(graph, ...)

# Default S3 method
as_diffnet(graph, ...)

# S3 method for class 'networkDynamic'
as_diffnet(graph, toavar, ...)

new_diffnet(
  graph,
  toa,
  t0 = min(toa, na.rm = TRUE),
  t1 = max(toa, na.rm = TRUE),
  vertex.dyn.attrs = NULL,
  vertex.static.attrs = NULL,
  id.and.per.vars = NULL,
  graph.attrs = NULL,
  undirected = getOption("diffnet.undirected"),
  self = getOption("diffnet.self"),
  multiple = getOption("diffnet.multiple"),
  name = "Diffusion Network",
  behavior = NULL
)

# S3 method for class 'diffnet'
as.data.frame(
  x,
  row.names = NULL,
  optional = FALSE,
  attr.class = c("dyn", "static"),
  ...
)

diffnet.attrs(
  graph,
  element = c("vertex", "graph"),
  attr.class = c("dyn", "static"),
  as.df = FALSE
)

diffnet.attrs(graph, element = "vertex", attr.class = "static") <- value

diffnet.toa(graph)

diffnet.toa(graph, i) <- value

# S3 method for class 'diffnet'
print(x, ...)

nodes(graph)

diffnetLapply(graph, FUN, ...)

# S3 method for class 'diffnet'
str(object, ...)

# S3 method for class 'diffnet'
dimnames(x)

# S3 method for class 'diffnet'
t(x)

# S3 method for class 'diffnet'
dim(x)

is_undirected(x)

# S3 method for class 'diffnet'
is_undirected(x)

# Default S3 method
is_undirected(x)

is_self(x)

# S3 method for class 'diffnet'
is_self(x)

# Default S3 method
is_self(x)

is_multiple(x)

# S3 method for class 'diffnet'
is_multiple(x)

# Default S3 method
is_multiple(x)

is_valued(x)

# S3 method for class 'diffnet'
is_valued(x)

# Default S3 method
is_valued(x)
Arguments
- graph
A dynamic graph (see
netdiffuseR-graphs).- ...
Further arguments passed to the jmethod.
- toavar
Character scalar. Name of the variable that holds the time of adoption.
- toa
Numeric vector of size \(n\). Times of adoption. For \(Q\) multiple behavior diffusion,
toamust be a matrix \(n \times Q\) (seerdiffnet, examples of multiple behavior diffusion).- t0
Integer scalar. Passed to
toa_mat.- t1
Integer scalar. Passed to
toa_mat.- vertex.dyn.attrs
Vertices dynamic attributes (see details).
- vertex.static.attrs
Vertices static attributes (see details).
- id.and.per.vars
A character vector of length 2. Optionally specified to check the order of the rows in the attribute data.
- graph.attrs
Graph dynamic attributes (not supported yet).
- undirected
Logical scalar. When
TRUEonly the lower triangle of the adjacency matrix will considered (faster).- self
Logical scalar. When
TRUEautolinks (loops, self edges) are allowed (see details).- multiple
Logical scalar. When
TRUEallows multiple edges.- name
Character scalar. Name of the diffusion network (descriptive).
- behavior
Character vector. Name of the behavior(s) been analyzed (innovation).
- x
A
diffnetobject.- row.names
Ignored.
- optional
Ignored.
- attr.class
Character vector/scalar. Indicates the class of the attribute, either dynamic (
"dyn"), or static ("static").- element
Character vector/scalar. Indicates what to retrieve/alter.
- as.df
Logical scalar. When TRUE returns a data.frame.
- value
In the case of
diffnet.toa, replacement, otherwise see below.- i
Indices specifying elements to replace. See
Extract.- FUN
a function to be passed to lapply
- object
A
diffnetobject.
Value
A list of class diffnet with the following elements:
- graph
A list of length \(T\). Containing sparse square matrices of size \(n\) and class
dgCMatrix.- toa
An integer vector of length \(n\) with times of adoption. When \(Q\) multiple behavior diffusion is selected, a matrix of size \(n \times Q\)
.
- adopt, cumadopt
Numeric matrices of size \(n\times T\) as those returned by
toa_mat. For \(Q\) multiple behavior diffusion,adoptandcumadoptbecome a list of \(n\times T\) elements, with \(Q\) elements.- vertex.static.attrs
If not NULL, a data frame with \(n\) rows with vertex static attributes.
- vertex.dyn.attrs
A list of length \(T\) with data frames containing vertex attributes throught time (dynamic).
- graph.attrs
A data frame with \(T\) rows.
- meta
A list of length 9 with the following elements:
type: Character scalar equal to"dynamic".class: Character scalar equal to"list".ids: Character vector of size \(n\) with vertices' labels.pers: Integer vector of size \(T\).nper: Integer scalar equal to \(T\).n: Integer scalar equal to \(n\).self: Logical scalar.undirected: Logical scalar.multiple: Logical scalar.name: Character scalar.behavior: A list of character scalars.
Details
diffnet objects hold both, static and dynamic vertex attributes. When
creating diffnet objects, these can be specified using the arguments
vertex.static.attrs and vertex.dyn.attrs; depending on whether
the attributes to specify are static or dynamic, netdiffuseR currently
supports the following objects:
| Class | Dimension | Check sorting |
| Static attributes | matrix | with \(n\) rows |
id | data.frame | with \(n\) rows |
id | vector | of length \(n\) |
| - | Dynamic attributes | |
matrix | with \(n\times T\) rows | id, per |
data.frame | with \(n\times T\) rows | id, per |
vector | of length \(n\times T\) | - |
list | of length \(T\) with matrices or data.frames of \(n\) rows | id, per |
The last column, Check sorting, lists the variables that
the user should specify if he wants the function to check the order of the rows
of the attributes (notice that this is not possible for the case of vectors).
By providing the name of the vertex id variable, id, and the time period
id variable, per, the function makes sure that the attribute data is
presented in the right order. See the example below. If the user does not
provide the names of the vertex id and time period variables then the function
does not check the way the rows are sorted, further it assumes that the data
is in the correct order.
The function `is_undirected` returns TRUE if the network is marked as undirected. In the case of `diffnet` objects, this information is stored in the `meta` element as `undirected`. The default method is to try to find an attribute called `undirected`, i.e., `attr(x, "undirected")`, if no attribute is found, then the function returns `FALSE`.
The functions `is_self`, `is_valued`, and `is_multiple` work exactly the same as `is_undirected`. `diffnet` networks are not valued.
Auxiliary functions
diffnet.attrs Allows retriving network attributes. In particular, by default
returns a list of length \(T\) with data frames with the following columns:
perIndicating the time period to which the observation corresponds.toaIndicating the time of adoption of the vertex.Further columns depending on the vertex and graph attributes.
Each vertex static attributes' are repeated \(T\) times in total so that these
can be binded (rbind) to dynamic attributes.
When as.df=TRUE, this convenience function is useful as it can be used
to create event history (panel data) datasets used for model fitting.
Conversely, the replacement method allows including new vertex or graph attributes either dynamic or static (see examples below).
diffnet.toa(graph) works as an alias of graph$toa.
The replacement method, diffnet.toa<- used as diffnet.toa(graph)<-...,
is the right way of modifying times of adoption as when doing so it
performs several checks on the time ranges, and
recalculates adoption and cumulative adoption matrices using toa_mat.
nodes(graph) is an alias for graph$meta$ids.
See also
Default options are listed at netdiffuseR-options
Other diffnet methods:
%*%(),
as.array.diffnet(),
c.diffnet(),
diffnet-arithmetic,
diffnet_index,
plot.diffnet(),
summary.diffnet()
Other data management functions:
edgelist_to_adjmat(),
egonet_attrs(),
isolated(),
survey_to_diffnet()
Examples
# Creating a diffnet object from TOA (time of adoption) ---------------------
# Creating a random graph
set.seed(123)
graph <- rgraph_ba(t=9)
graph <- lapply(1:5, function(x) graph)
# Pretty TOA
names(graph) <- 2001L:2005L
toa <- sample(c(2001L:2005L,NA), 10, TRUE)
# Creating diffnet object
diffnet <- new_diffnet(graph, toa)
diffnet
#> Dynamic network of class -diffnet-
#> Name : Diffusion Network
#> Behavior : Unknown
#> # of nodes : 10 (1, 2, 3, 4, 5, 6, 7, 8, ...)
#> # of time periods : 5 (2001 - 2005)
#> Type : directed
#> Num of behaviors : 1
#> Final prevalence : 0.80
#> Static attributes : -
#> Dynamic attributes : -
summary(diffnet)
#> Diffusion network summary statistics
#> Name : Diffusion Network
#> Behavior : Unknown
#> -----------------------------------------------------------------------------
#> Period Adopters Cum Adopt. (%) Hazard Rate Density Moran's I (sd)
#> -------- ---------- ---------------- ------------- --------- ----------------
#> 2001 1 1 (0.10) - 0.11 -0.03 (0.15)
#> 2002 1 2 (0.20) 0.11 0.11 0.09 (0.20)
#> 2003 3 5 (0.50) 0.37 0.11 0.00 (0.22)
#> 2004 1 6 (0.60) 0.20 0.11 -0.32 (0.22)
#> 2005 2 8 (0.80) 0.50 0.11 -0.39 (0.20)
#> -----------------------------------------------------------------------------
#> Left censoring : 0.10 (1)
#> Right centoring : 0.20 (2)
#> # of nodes : 10
#>
#> Moran's I was computed on contemporaneous autocorrelation using 1/geodesic
#> values. Significane levels *** <= .01, ** <= .05, * <= .1.
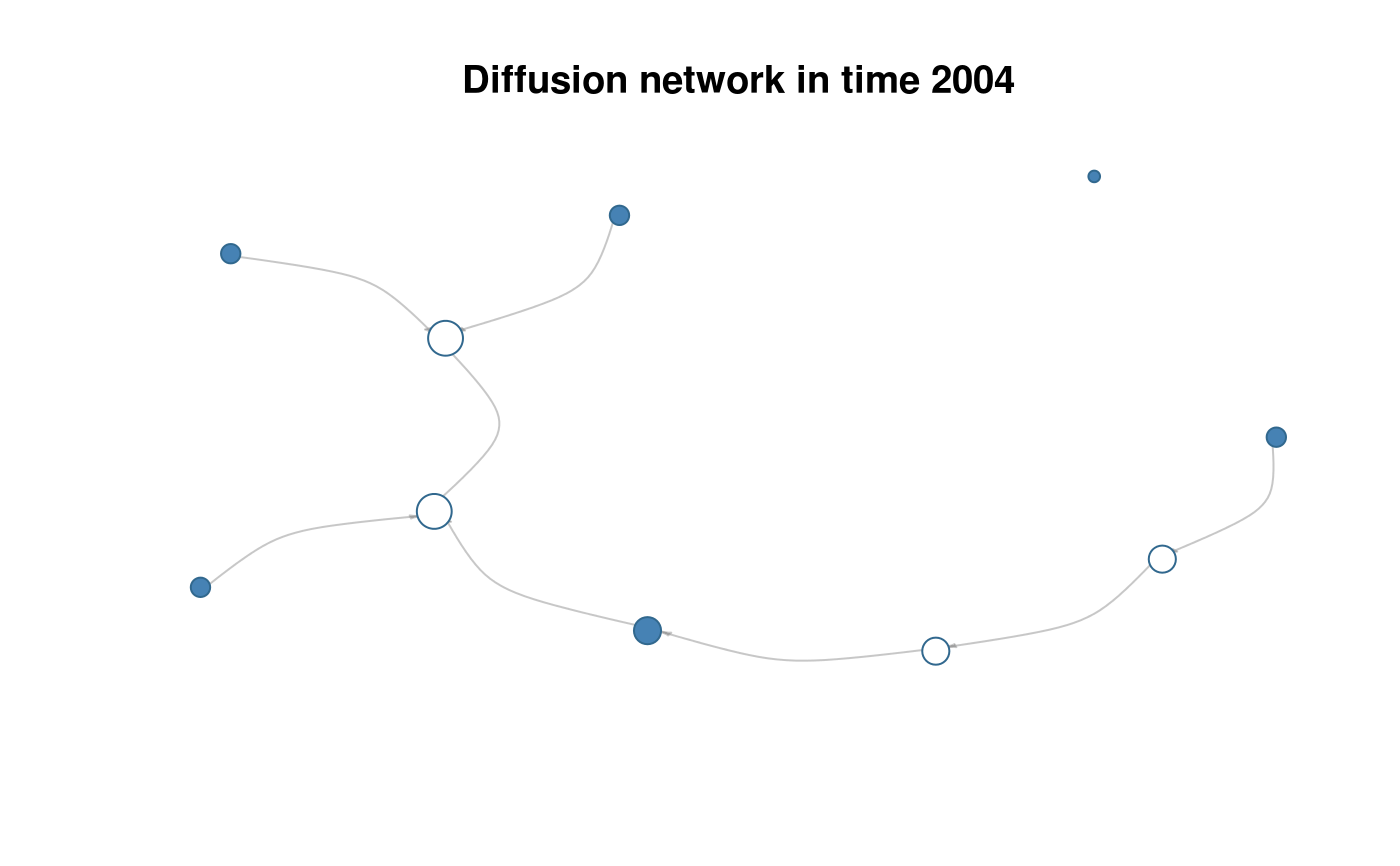
# Plotting slice 4
plot(diffnet, t=4)
 # A diffnet object from TOA of multiple behaviors ---------------------------
# TOA for two behaviors
toa_matrix <- matrix(sample(c(2001L:2005L,NA), 20, TRUE), ncol = 2)
# Creating diffnet object
diffnet_multi <- new_diffnet(graph, toa_matrix)
#> Warning: Coercing -toa- into integer.
diffnet_multi
#> Dynamic network of class -diffnet-
#> Name : Diffusion Network
#> Behavior : Unknown, Unknown
#> # of nodes : 10 (1, 2, 3, 4, 5, 6, 7, 8, ...)
#> # of time periods : 5 (2001 - 2005)
#> Type : directed
#> Num of behaviors : 2
#> Prevalence : 0.80, 0.70
#> Static attributes : -
#> Dynamic attributes : -
summary(diffnet_multi)
#> Diffusion network summary statistics
#> Name : Diffusion Network
#>
#> Behavior : Unknown
#> -----------------------------------------------------------------------------
#> Period Adopters Cum Adopt. (%) Hazard Rate Density Moran's I (sd)
#> -------- ---------- ---------------- ------------- --------- ----------------
#> 2001 1 1 (0.10) - 0.11 -0.03 (0.15)
#> 2002 2 3 (0.30) 0.22 0.11 -0.43 (0.21)
#> 2003 1 4 (0.40) 0.14 0.11 -0.44 (0.22)
#> 2004 3 7 (0.70) 0.50 0.11 -0.36 (0.21)
#> 2005 1 8 (0.80) 0.33 0.11 -0.11 (0.20)
#> -----------------------------------------------------------------------------
#> Left censoring : 0.10 (1)
#> Right centoring : 0.30 (2)
#>
#> Behavior : Unknown
#> -----------------------------------------------------------------------------
#> Period Adopters Cum Adopt. (%) Hazard Rate Density Moran's I (sd)
#> -------- ---------- ---------------- ------------- --------- ----------------
#> 2001 1 1 (0.10) - 0.11 -0.03 (0.15)
#> 2002 3 4 (0.40) 0.33 0.11 0.04 (0.22)
#> 2003 1 5 (0.50) 0.17 0.11 -0.08 (0.22)
#> 2004 2 7 (0.70) 0.40 0.11 0.26 (0.21) *
#> 2005 0 7 (0.70) 0.00 0.11 0.26 (0.21) *
#> -----------------------------------------------------------------------------
#> Left censoring : 0.10 (1)
#> Right centoring : 0.30 (3)
#> # of nodes : 10
#>
#> Moran's I was computed on contemporaneous autocorrelation using 1/geodesic
#> values. Significane levels *** <= .01, ** <= .05, * <= .1.
# ATTRIBUTES ----------------------------------------------------------------
# Retrieving attributes
diffnet.attrs(diffnet, "vertex", "static")
#> $`2001`
#> per toa
#> 1 2001 2005
#> 2 2001 2004
#> 3 2001 NA
#> 4 2001 NA
#> 5 2001 2001
#> 6 2001 2002
#> 7 2001 2003
#> 8 2001 2005
#> 9 2001 2003
#> 10 2001 2003
#>
#> $`2002`
#> per toa
#> 1 2002 2005
#> 2 2002 2004
#> 3 2002 NA
#> 4 2002 NA
#> 5 2002 2001
#> 6 2002 2002
#> 7 2002 2003
#> 8 2002 2005
#> 9 2002 2003
#> 10 2002 2003
#>
#> $`2003`
#> per toa
#> 1 2003 2005
#> 2 2003 2004
#> 3 2003 NA
#> 4 2003 NA
#> 5 2003 2001
#> 6 2003 2002
#> 7 2003 2003
#> 8 2003 2005
#> 9 2003 2003
#> 10 2003 2003
#>
#> $`2004`
#> per toa
#> 1 2004 2005
#> 2 2004 2004
#> 3 2004 NA
#> 4 2004 NA
#> 5 2004 2001
#> 6 2004 2002
#> 7 2004 2003
#> 8 2004 2005
#> 9 2004 2003
#> 10 2004 2003
#>
#> $`2005`
#> per toa
#> 1 2005 2005
#> 2 2005 2004
#> 3 2005 NA
#> 4 2005 NA
#> 5 2005 2001
#> 6 2005 2002
#> 7 2005 2003
#> 8 2005 2005
#> 9 2005 2003
#> 10 2005 2003
#>
# Now as a data.frame (only static)
diffnet.attrs(diffnet, "vertex", "static", as.df = TRUE)
#> per toa id
#> 1 2001 2005 1
#> 2 2001 2004 2
#> 3 2001 NA 3
#> 4 2001 NA 4
#> 5 2001 2001 5
#> 6 2001 2002 6
#> 7 2001 2003 7
#> 8 2001 2005 8
#> 9 2001 2003 9
#> 10 2001 2003 10
#> 11 2002 2005 1
#> 12 2002 2004 2
#> 13 2002 NA 3
#> 14 2002 NA 4
#> 15 2002 2001 5
#> 16 2002 2002 6
#> 17 2002 2003 7
#> 18 2002 2005 8
#> 19 2002 2003 9
#> 20 2002 2003 10
#> 21 2003 2005 1
#> 22 2003 2004 2
#> 23 2003 NA 3
#> 24 2003 NA 4
#> 25 2003 2001 5
#> 26 2003 2002 6
#> 27 2003 2003 7
#> 28 2003 2005 8
#> 29 2003 2003 9
#> 30 2003 2003 10
#> 31 2004 2005 1
#> 32 2004 2004 2
#> 33 2004 NA 3
#> 34 2004 NA 4
#> 35 2004 2001 5
#> 36 2004 2002 6
#> 37 2004 2003 7
#> 38 2004 2005 8
#> 39 2004 2003 9
#> 40 2004 2003 10
#> 41 2005 2005 1
#> 42 2005 2004 2
#> 43 2005 NA 3
#> 44 2005 NA 4
#> 45 2005 2001 5
#> 46 2005 2002 6
#> 47 2005 2003 7
#> 48 2005 2005 8
#> 49 2005 2003 9
#> 50 2005 2003 10
# Now as a data.frame (all of them)
diffnet.attrs(diffnet, as.df = TRUE)
#> per toa id
#> 1 2001 2005 1
#> 2 2001 2004 2
#> 3 2001 NA 3
#> 4 2001 NA 4
#> 5 2001 2001 5
#> 6 2001 2002 6
#> 7 2001 2003 7
#> 8 2001 2005 8
#> 9 2001 2003 9
#> 10 2001 2003 10
#> 11 2002 2005 1
#> 12 2002 2004 2
#> 13 2002 NA 3
#> 14 2002 NA 4
#> 15 2002 2001 5
#> 16 2002 2002 6
#> 17 2002 2003 7
#> 18 2002 2005 8
#> 19 2002 2003 9
#> 20 2002 2003 10
#> 21 2003 2005 1
#> 22 2003 2004 2
#> 23 2003 NA 3
#> 24 2003 NA 4
#> 25 2003 2001 5
#> 26 2003 2002 6
#> 27 2003 2003 7
#> 28 2003 2005 8
#> 29 2003 2003 9
#> 30 2003 2003 10
#> 31 2004 2005 1
#> 32 2004 2004 2
#> 33 2004 NA 3
#> 34 2004 NA 4
#> 35 2004 2001 5
#> 36 2004 2002 6
#> 37 2004 2003 7
#> 38 2004 2005 8
#> 39 2004 2003 9
#> 40 2004 2003 10
#> 41 2005 2005 1
#> 42 2005 2004 2
#> 43 2005 NA 3
#> 44 2005 NA 4
#> 45 2005 2001 5
#> 46 2005 2002 6
#> 47 2005 2003 7
#> 48 2005 2005 8
#> 49 2005 2003 9
#> 50 2005 2003 10
as.data.frame(diffnet) # This is a wrapper
#> per toa id
#> 1 2001 2005 1
#> 2 2001 2004 2
#> 3 2001 NA 3
#> 4 2001 NA 4
#> 5 2001 2001 5
#> 6 2001 2002 6
#> 7 2001 2003 7
#> 8 2001 2005 8
#> 9 2001 2003 9
#> 10 2001 2003 10
#> 11 2002 2005 1
#> 12 2002 2004 2
#> 13 2002 NA 3
#> 14 2002 NA 4
#> 15 2002 2001 5
#> 16 2002 2002 6
#> 17 2002 2003 7
#> 18 2002 2005 8
#> 19 2002 2003 9
#> 20 2002 2003 10
#> 21 2003 2005 1
#> 22 2003 2004 2
#> 23 2003 NA 3
#> 24 2003 NA 4
#> 25 2003 2001 5
#> 26 2003 2002 6
#> 27 2003 2003 7
#> 28 2003 2005 8
#> 29 2003 2003 9
#> 30 2003 2003 10
#> 31 2004 2005 1
#> 32 2004 2004 2
#> 33 2004 NA 3
#> 34 2004 NA 4
#> 35 2004 2001 5
#> 36 2004 2002 6
#> 37 2004 2003 7
#> 38 2004 2005 8
#> 39 2004 2003 9
#> 40 2004 2003 10
#> 41 2005 2005 1
#> 42 2005 2004 2
#> 43 2005 NA 3
#> 44 2005 NA 4
#> 45 2005 2001 5
#> 46 2005 2002 6
#> 47 2005 2003 7
#> 48 2005 2005 8
#> 49 2005 2003 9
#> 50 2005 2003 10
# Unsorted data -------------------------------------------------------------
# Loading example data
data(fakesurveyDyn)
# Creating a diffnet object
fs_diffnet <- survey_to_diffnet(
fakesurveyDyn, "id", c("net1", "net2", "net3"), "toa", "group",
timevar = "time", keep.isolates=TRUE, warn.coercion=FALSE)
# Now, we extract the graph data and create a diffnet object from scratch
graph <- fs_diffnet$graph
ids <- fs_diffnet$meta$ids
graph <- Map(function(g) {
dimnames(g) <- list(ids,ids)
g
}, g=graph)
attrs <- diffnet.attrs(fs_diffnet, as.df=TRUE)
toa <- diffnet.toa(fs_diffnet)
# Lets apply a different sorting to the data to see if it works
n <- nrow(attrs)
attrs <- attrs[order(runif(n)),]
# Now, recreating the old diffnet object (notice -id.and.per.vars- arg)
fs_diffnet_new <- new_diffnet(graph, toa=toa, vertex.dyn.attrs=attrs,
id.and.per.vars = c("id", "per"))
# Now, retrieving attributes. The 'new one' will have more (repeated)
attrs_new <- diffnet.attrs(fs_diffnet_new, as.df=TRUE)
attrs_old <- diffnet.attrs(fs_diffnet, as.df=TRUE)
# Comparing elements!
tocompare <- intersect(colnames(attrs_new), colnames(attrs_old))
all(attrs_new[,tocompare] == attrs_old[,tocompare], na.rm = TRUE) # TRUE!
#> [1] TRUE
# diffnetLapply -------------------------------------------------------------
data(medInnovationsDiffNet)
diffnetLapply(medInnovationsDiffNet, function(x, cumadopt, ...) {sum(cumadopt)})
#> [[1]]
#> [1] 11
#>
#> [[2]]
#> [1] 20
#>
#> [[3]]
#> [1] 29
#>
#> [[4]]
#> [1] 40
#>
#> [[5]]
#> [1] 51
#>
#> [[6]]
#> [1] 62
#>
#> [[7]]
#> [1] 75
#>
#> [[8]]
#> [1] 82
#>
#> [[9]]
#> [1] 86
#>
#> [[10]]
#> [1] 87
#>
#> [[11]]
#> [1] 92
#>
#> [[12]]
#> [1] 95
#>
#> [[13]]
#> [1] 98
#>
#> [[14]]
#> [1] 102
#>
#> [[15]]
#> [1] 106
#>
#> [[16]]
#> [1] 108
#>
#> [[17]]
#> [1] 109
#>
#> [[18]]
#> [1] 125
#>
# A diffnet object from TOA of multiple behaviors ---------------------------
# TOA for two behaviors
toa_matrix <- matrix(sample(c(2001L:2005L,NA), 20, TRUE), ncol = 2)
# Creating diffnet object
diffnet_multi <- new_diffnet(graph, toa_matrix)
#> Warning: Coercing -toa- into integer.
diffnet_multi
#> Dynamic network of class -diffnet-
#> Name : Diffusion Network
#> Behavior : Unknown, Unknown
#> # of nodes : 10 (1, 2, 3, 4, 5, 6, 7, 8, ...)
#> # of time periods : 5 (2001 - 2005)
#> Type : directed
#> Num of behaviors : 2
#> Prevalence : 0.80, 0.70
#> Static attributes : -
#> Dynamic attributes : -
summary(diffnet_multi)
#> Diffusion network summary statistics
#> Name : Diffusion Network
#>
#> Behavior : Unknown
#> -----------------------------------------------------------------------------
#> Period Adopters Cum Adopt. (%) Hazard Rate Density Moran's I (sd)
#> -------- ---------- ---------------- ------------- --------- ----------------
#> 2001 1 1 (0.10) - 0.11 -0.03 (0.15)
#> 2002 2 3 (0.30) 0.22 0.11 -0.43 (0.21)
#> 2003 1 4 (0.40) 0.14 0.11 -0.44 (0.22)
#> 2004 3 7 (0.70) 0.50 0.11 -0.36 (0.21)
#> 2005 1 8 (0.80) 0.33 0.11 -0.11 (0.20)
#> -----------------------------------------------------------------------------
#> Left censoring : 0.10 (1)
#> Right centoring : 0.30 (2)
#>
#> Behavior : Unknown
#> -----------------------------------------------------------------------------
#> Period Adopters Cum Adopt. (%) Hazard Rate Density Moran's I (sd)
#> -------- ---------- ---------------- ------------- --------- ----------------
#> 2001 1 1 (0.10) - 0.11 -0.03 (0.15)
#> 2002 3 4 (0.40) 0.33 0.11 0.04 (0.22)
#> 2003 1 5 (0.50) 0.17 0.11 -0.08 (0.22)
#> 2004 2 7 (0.70) 0.40 0.11 0.26 (0.21) *
#> 2005 0 7 (0.70) 0.00 0.11 0.26 (0.21) *
#> -----------------------------------------------------------------------------
#> Left censoring : 0.10 (1)
#> Right centoring : 0.30 (3)
#> # of nodes : 10
#>
#> Moran's I was computed on contemporaneous autocorrelation using 1/geodesic
#> values. Significane levels *** <= .01, ** <= .05, * <= .1.
# ATTRIBUTES ----------------------------------------------------------------
# Retrieving attributes
diffnet.attrs(diffnet, "vertex", "static")
#> $`2001`
#> per toa
#> 1 2001 2005
#> 2 2001 2004
#> 3 2001 NA
#> 4 2001 NA
#> 5 2001 2001
#> 6 2001 2002
#> 7 2001 2003
#> 8 2001 2005
#> 9 2001 2003
#> 10 2001 2003
#>
#> $`2002`
#> per toa
#> 1 2002 2005
#> 2 2002 2004
#> 3 2002 NA
#> 4 2002 NA
#> 5 2002 2001
#> 6 2002 2002
#> 7 2002 2003
#> 8 2002 2005
#> 9 2002 2003
#> 10 2002 2003
#>
#> $`2003`
#> per toa
#> 1 2003 2005
#> 2 2003 2004
#> 3 2003 NA
#> 4 2003 NA
#> 5 2003 2001
#> 6 2003 2002
#> 7 2003 2003
#> 8 2003 2005
#> 9 2003 2003
#> 10 2003 2003
#>
#> $`2004`
#> per toa
#> 1 2004 2005
#> 2 2004 2004
#> 3 2004 NA
#> 4 2004 NA
#> 5 2004 2001
#> 6 2004 2002
#> 7 2004 2003
#> 8 2004 2005
#> 9 2004 2003
#> 10 2004 2003
#>
#> $`2005`
#> per toa
#> 1 2005 2005
#> 2 2005 2004
#> 3 2005 NA
#> 4 2005 NA
#> 5 2005 2001
#> 6 2005 2002
#> 7 2005 2003
#> 8 2005 2005
#> 9 2005 2003
#> 10 2005 2003
#>
# Now as a data.frame (only static)
diffnet.attrs(diffnet, "vertex", "static", as.df = TRUE)
#> per toa id
#> 1 2001 2005 1
#> 2 2001 2004 2
#> 3 2001 NA 3
#> 4 2001 NA 4
#> 5 2001 2001 5
#> 6 2001 2002 6
#> 7 2001 2003 7
#> 8 2001 2005 8
#> 9 2001 2003 9
#> 10 2001 2003 10
#> 11 2002 2005 1
#> 12 2002 2004 2
#> 13 2002 NA 3
#> 14 2002 NA 4
#> 15 2002 2001 5
#> 16 2002 2002 6
#> 17 2002 2003 7
#> 18 2002 2005 8
#> 19 2002 2003 9
#> 20 2002 2003 10
#> 21 2003 2005 1
#> 22 2003 2004 2
#> 23 2003 NA 3
#> 24 2003 NA 4
#> 25 2003 2001 5
#> 26 2003 2002 6
#> 27 2003 2003 7
#> 28 2003 2005 8
#> 29 2003 2003 9
#> 30 2003 2003 10
#> 31 2004 2005 1
#> 32 2004 2004 2
#> 33 2004 NA 3
#> 34 2004 NA 4
#> 35 2004 2001 5
#> 36 2004 2002 6
#> 37 2004 2003 7
#> 38 2004 2005 8
#> 39 2004 2003 9
#> 40 2004 2003 10
#> 41 2005 2005 1
#> 42 2005 2004 2
#> 43 2005 NA 3
#> 44 2005 NA 4
#> 45 2005 2001 5
#> 46 2005 2002 6
#> 47 2005 2003 7
#> 48 2005 2005 8
#> 49 2005 2003 9
#> 50 2005 2003 10
# Now as a data.frame (all of them)
diffnet.attrs(diffnet, as.df = TRUE)
#> per toa id
#> 1 2001 2005 1
#> 2 2001 2004 2
#> 3 2001 NA 3
#> 4 2001 NA 4
#> 5 2001 2001 5
#> 6 2001 2002 6
#> 7 2001 2003 7
#> 8 2001 2005 8
#> 9 2001 2003 9
#> 10 2001 2003 10
#> 11 2002 2005 1
#> 12 2002 2004 2
#> 13 2002 NA 3
#> 14 2002 NA 4
#> 15 2002 2001 5
#> 16 2002 2002 6
#> 17 2002 2003 7
#> 18 2002 2005 8
#> 19 2002 2003 9
#> 20 2002 2003 10
#> 21 2003 2005 1
#> 22 2003 2004 2
#> 23 2003 NA 3
#> 24 2003 NA 4
#> 25 2003 2001 5
#> 26 2003 2002 6
#> 27 2003 2003 7
#> 28 2003 2005 8
#> 29 2003 2003 9
#> 30 2003 2003 10
#> 31 2004 2005 1
#> 32 2004 2004 2
#> 33 2004 NA 3
#> 34 2004 NA 4
#> 35 2004 2001 5
#> 36 2004 2002 6
#> 37 2004 2003 7
#> 38 2004 2005 8
#> 39 2004 2003 9
#> 40 2004 2003 10
#> 41 2005 2005 1
#> 42 2005 2004 2
#> 43 2005 NA 3
#> 44 2005 NA 4
#> 45 2005 2001 5
#> 46 2005 2002 6
#> 47 2005 2003 7
#> 48 2005 2005 8
#> 49 2005 2003 9
#> 50 2005 2003 10
as.data.frame(diffnet) # This is a wrapper
#> per toa id
#> 1 2001 2005 1
#> 2 2001 2004 2
#> 3 2001 NA 3
#> 4 2001 NA 4
#> 5 2001 2001 5
#> 6 2001 2002 6
#> 7 2001 2003 7
#> 8 2001 2005 8
#> 9 2001 2003 9
#> 10 2001 2003 10
#> 11 2002 2005 1
#> 12 2002 2004 2
#> 13 2002 NA 3
#> 14 2002 NA 4
#> 15 2002 2001 5
#> 16 2002 2002 6
#> 17 2002 2003 7
#> 18 2002 2005 8
#> 19 2002 2003 9
#> 20 2002 2003 10
#> 21 2003 2005 1
#> 22 2003 2004 2
#> 23 2003 NA 3
#> 24 2003 NA 4
#> 25 2003 2001 5
#> 26 2003 2002 6
#> 27 2003 2003 7
#> 28 2003 2005 8
#> 29 2003 2003 9
#> 30 2003 2003 10
#> 31 2004 2005 1
#> 32 2004 2004 2
#> 33 2004 NA 3
#> 34 2004 NA 4
#> 35 2004 2001 5
#> 36 2004 2002 6
#> 37 2004 2003 7
#> 38 2004 2005 8
#> 39 2004 2003 9
#> 40 2004 2003 10
#> 41 2005 2005 1
#> 42 2005 2004 2
#> 43 2005 NA 3
#> 44 2005 NA 4
#> 45 2005 2001 5
#> 46 2005 2002 6
#> 47 2005 2003 7
#> 48 2005 2005 8
#> 49 2005 2003 9
#> 50 2005 2003 10
# Unsorted data -------------------------------------------------------------
# Loading example data
data(fakesurveyDyn)
# Creating a diffnet object
fs_diffnet <- survey_to_diffnet(
fakesurveyDyn, "id", c("net1", "net2", "net3"), "toa", "group",
timevar = "time", keep.isolates=TRUE, warn.coercion=FALSE)
# Now, we extract the graph data and create a diffnet object from scratch
graph <- fs_diffnet$graph
ids <- fs_diffnet$meta$ids
graph <- Map(function(g) {
dimnames(g) <- list(ids,ids)
g
}, g=graph)
attrs <- diffnet.attrs(fs_diffnet, as.df=TRUE)
toa <- diffnet.toa(fs_diffnet)
# Lets apply a different sorting to the data to see if it works
n <- nrow(attrs)
attrs <- attrs[order(runif(n)),]
# Now, recreating the old diffnet object (notice -id.and.per.vars- arg)
fs_diffnet_new <- new_diffnet(graph, toa=toa, vertex.dyn.attrs=attrs,
id.and.per.vars = c("id", "per"))
# Now, retrieving attributes. The 'new one' will have more (repeated)
attrs_new <- diffnet.attrs(fs_diffnet_new, as.df=TRUE)
attrs_old <- diffnet.attrs(fs_diffnet, as.df=TRUE)
# Comparing elements!
tocompare <- intersect(colnames(attrs_new), colnames(attrs_old))
all(attrs_new[,tocompare] == attrs_old[,tocompare], na.rm = TRUE) # TRUE!
#> [1] TRUE
# diffnetLapply -------------------------------------------------------------
data(medInnovationsDiffNet)
diffnetLapply(medInnovationsDiffNet, function(x, cumadopt, ...) {sum(cumadopt)})
#> [[1]]
#> [1] 11
#>
#> [[2]]
#> [1] 20
#>
#> [[3]]
#> [1] 29
#>
#> [[4]]
#> [1] 40
#>
#> [[5]]
#> [1] 51
#>
#> [[6]]
#> [1] 62
#>
#> [[7]]
#> [1] 75
#>
#> [[8]]
#> [1] 82
#>
#> [[9]]
#> [1] 86
#>
#> [[10]]
#> [1] 87
#>
#> [[11]]
#> [1] 92
#>
#> [[12]]
#> [1] 95
#>
#> [[13]]
#> [1] 98
#>
#> [[14]]
#> [1] 102
#>
#> [[15]]
#> [1] 106
#>
#> [[16]]
#> [1] 108
#>
#> [[17]]
#> [1] 109
#>
#> [[18]]
#> [1] 125
#>