Introduction
Outline
Introduction to the network diffusion model and the motivation for netdiffuseR
The classic datasets (MI, BF & KFP)
Simulating diffusion with netdiffuseR
Data management features
The FCTC study – multiple networks both static and dynamic
Acknowledgements
NetDiffuseR was created with the support of grant R01 CA157577 from the National Cancer Institute/National Institutes of Health.
It has benefited from input provided by participants of the Center for Applied Network Analysis at the University of Southern California
Motivation for NetdifusseR
Build a platform in which:
network exposure terms can be easily calculated and compared;
other diffusion network terms can be created (e.g., Moran’s I, infectiousness, susceptibility);
multiple dynamic and static networks can be analyzed simultaneously;
Graphical displays of diffusion processes can be made;
Statistical tests both conventional and new can be conducted;
Integrate network diffusion models with other analytic approaches;
and more.
Diffusion Networks
Unique set of studies that combine social network data with behavioral data
Typically have data from zero or low prevalence to saturation or high prevalence.
Multiple time points presents unique opportunities and challenges.
Data often do not include dis-adoption but the model accounts for it.
Network data may be static or dynamic.
Can have one or multiple networks
Model multiple behaviors simultaneously (e.g., tobacco & alcohol, awareness & adoption, VHS & Betamax)
Because we combine networks and behavior
Can have people in the network with no adoption data
People with adoption data but not in the network
Diffusion of Innovations
Explains how new ideas and practices spread within and between communities.
One of the oldest and richest social science theories.
Many factors influence diffusion
Spatial
Economic
Cultural
Developmental
Biological
Etc.
One of the most significant is social networks
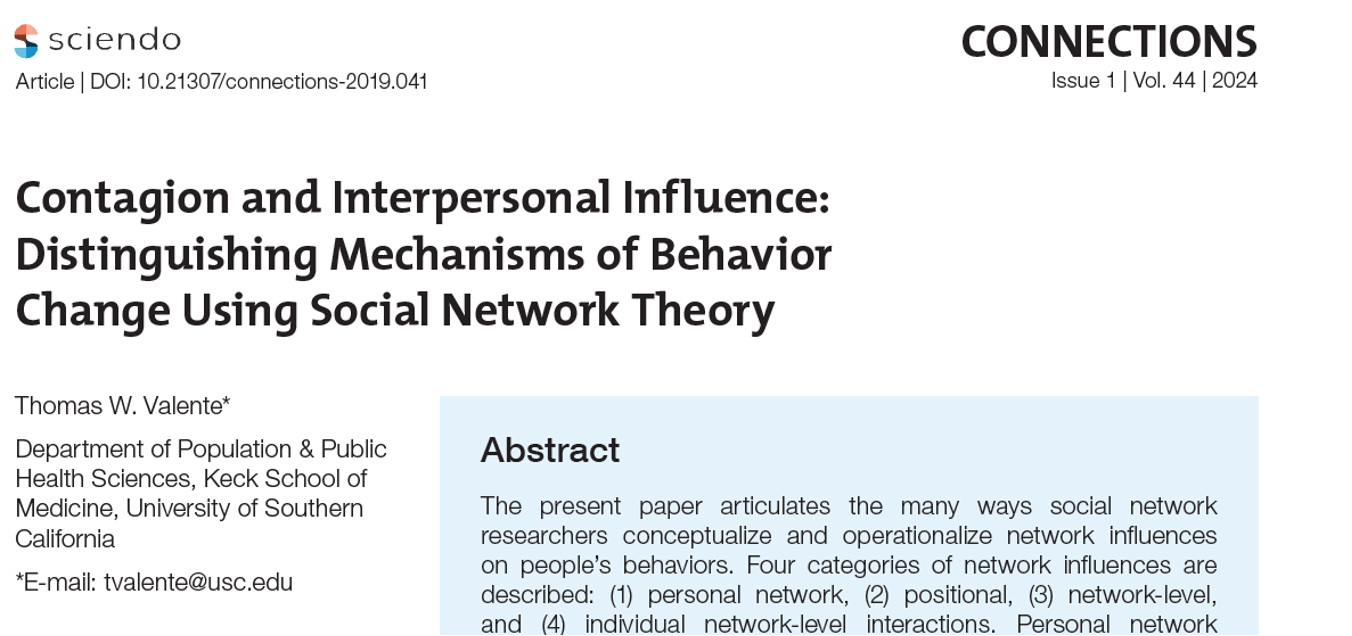
Diffusion Networks
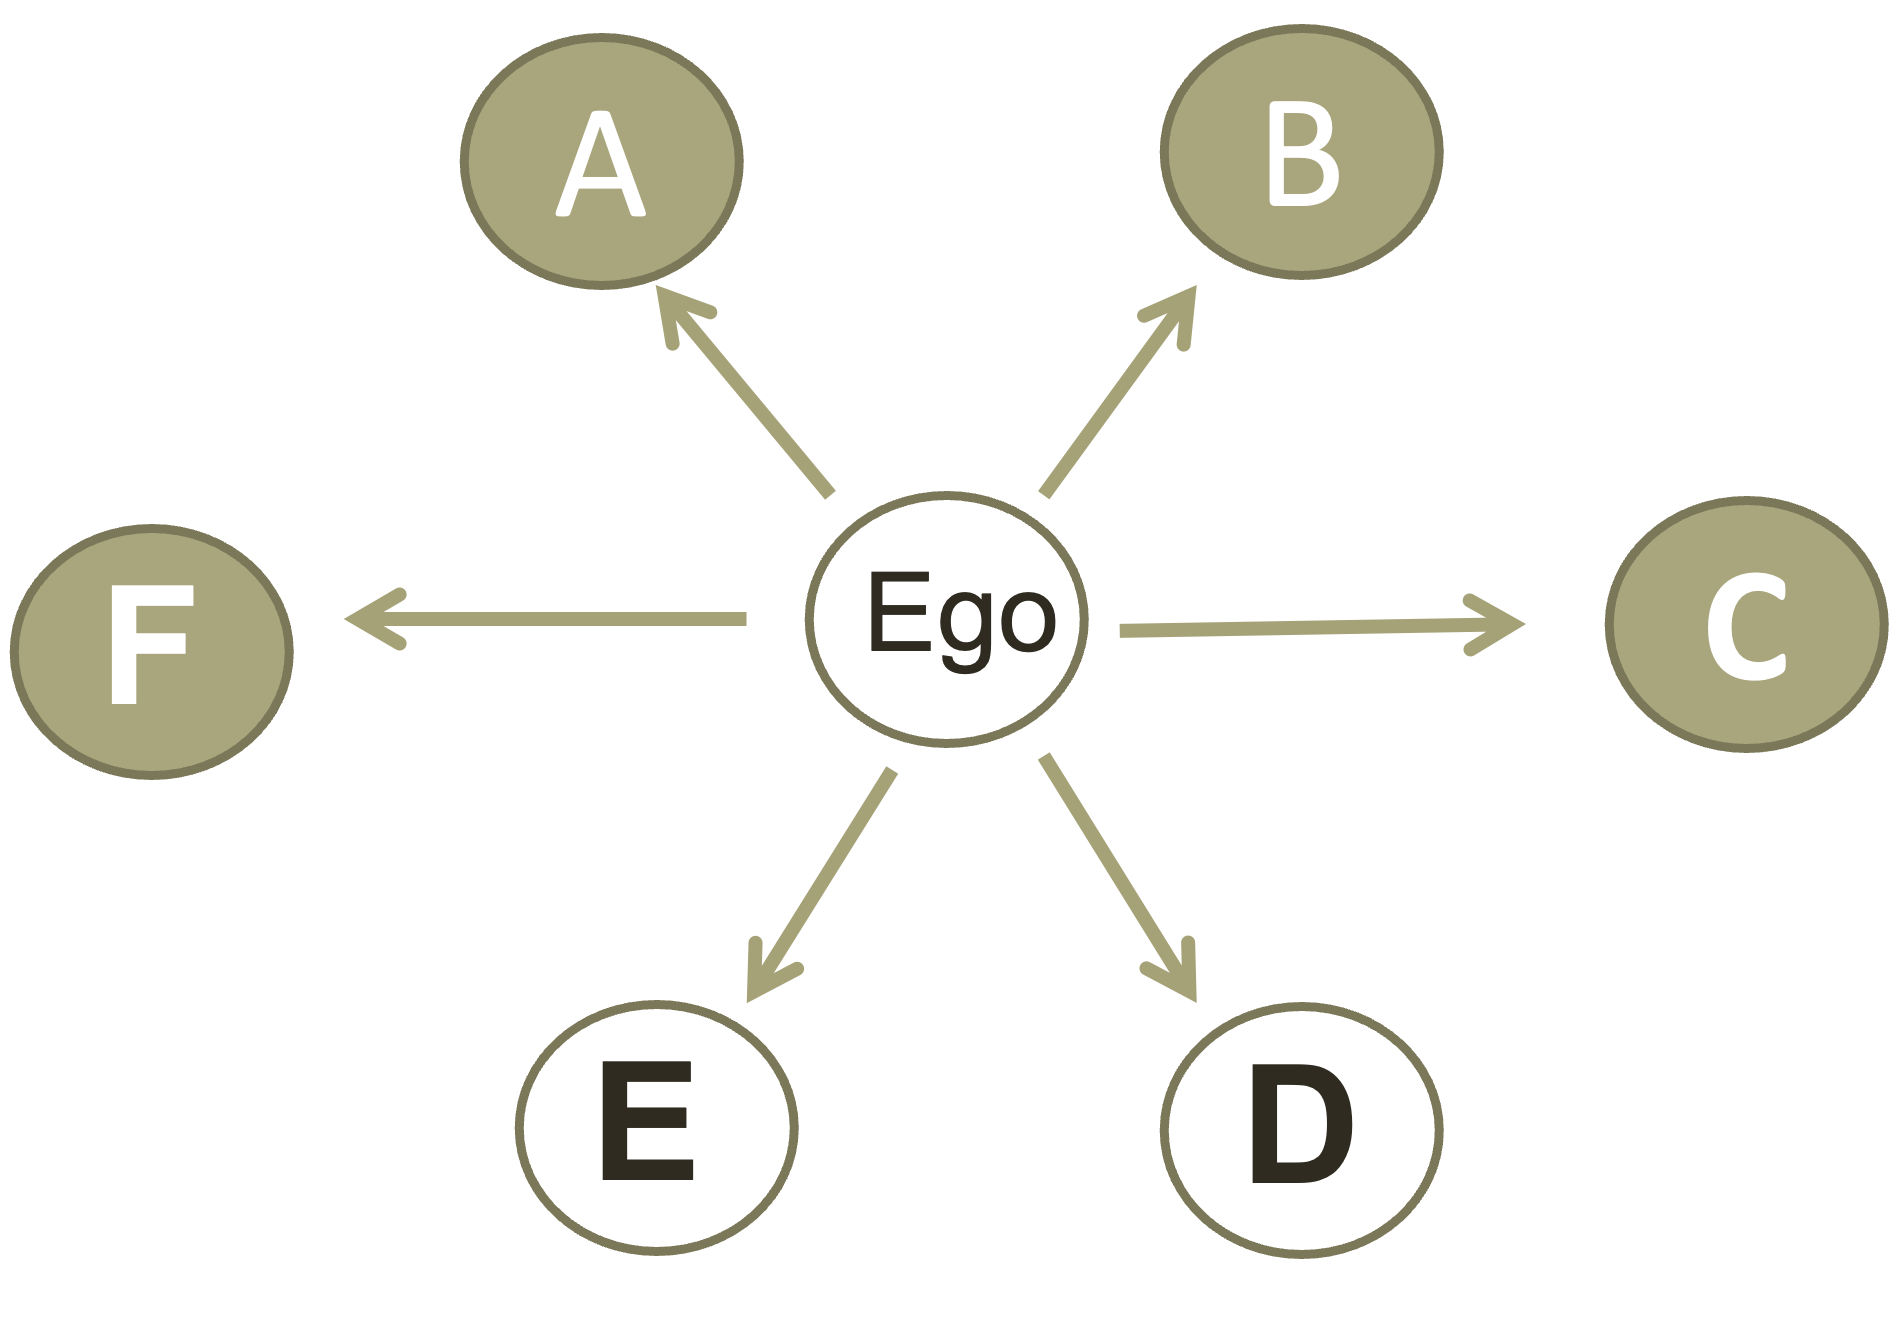
Structural Equivalence is Associated with Influence
Burt, R. (1987) Social contagion and innovation: Cohesion versus structural equivalence. American Journal of Sociology, 92, 1287-1335.
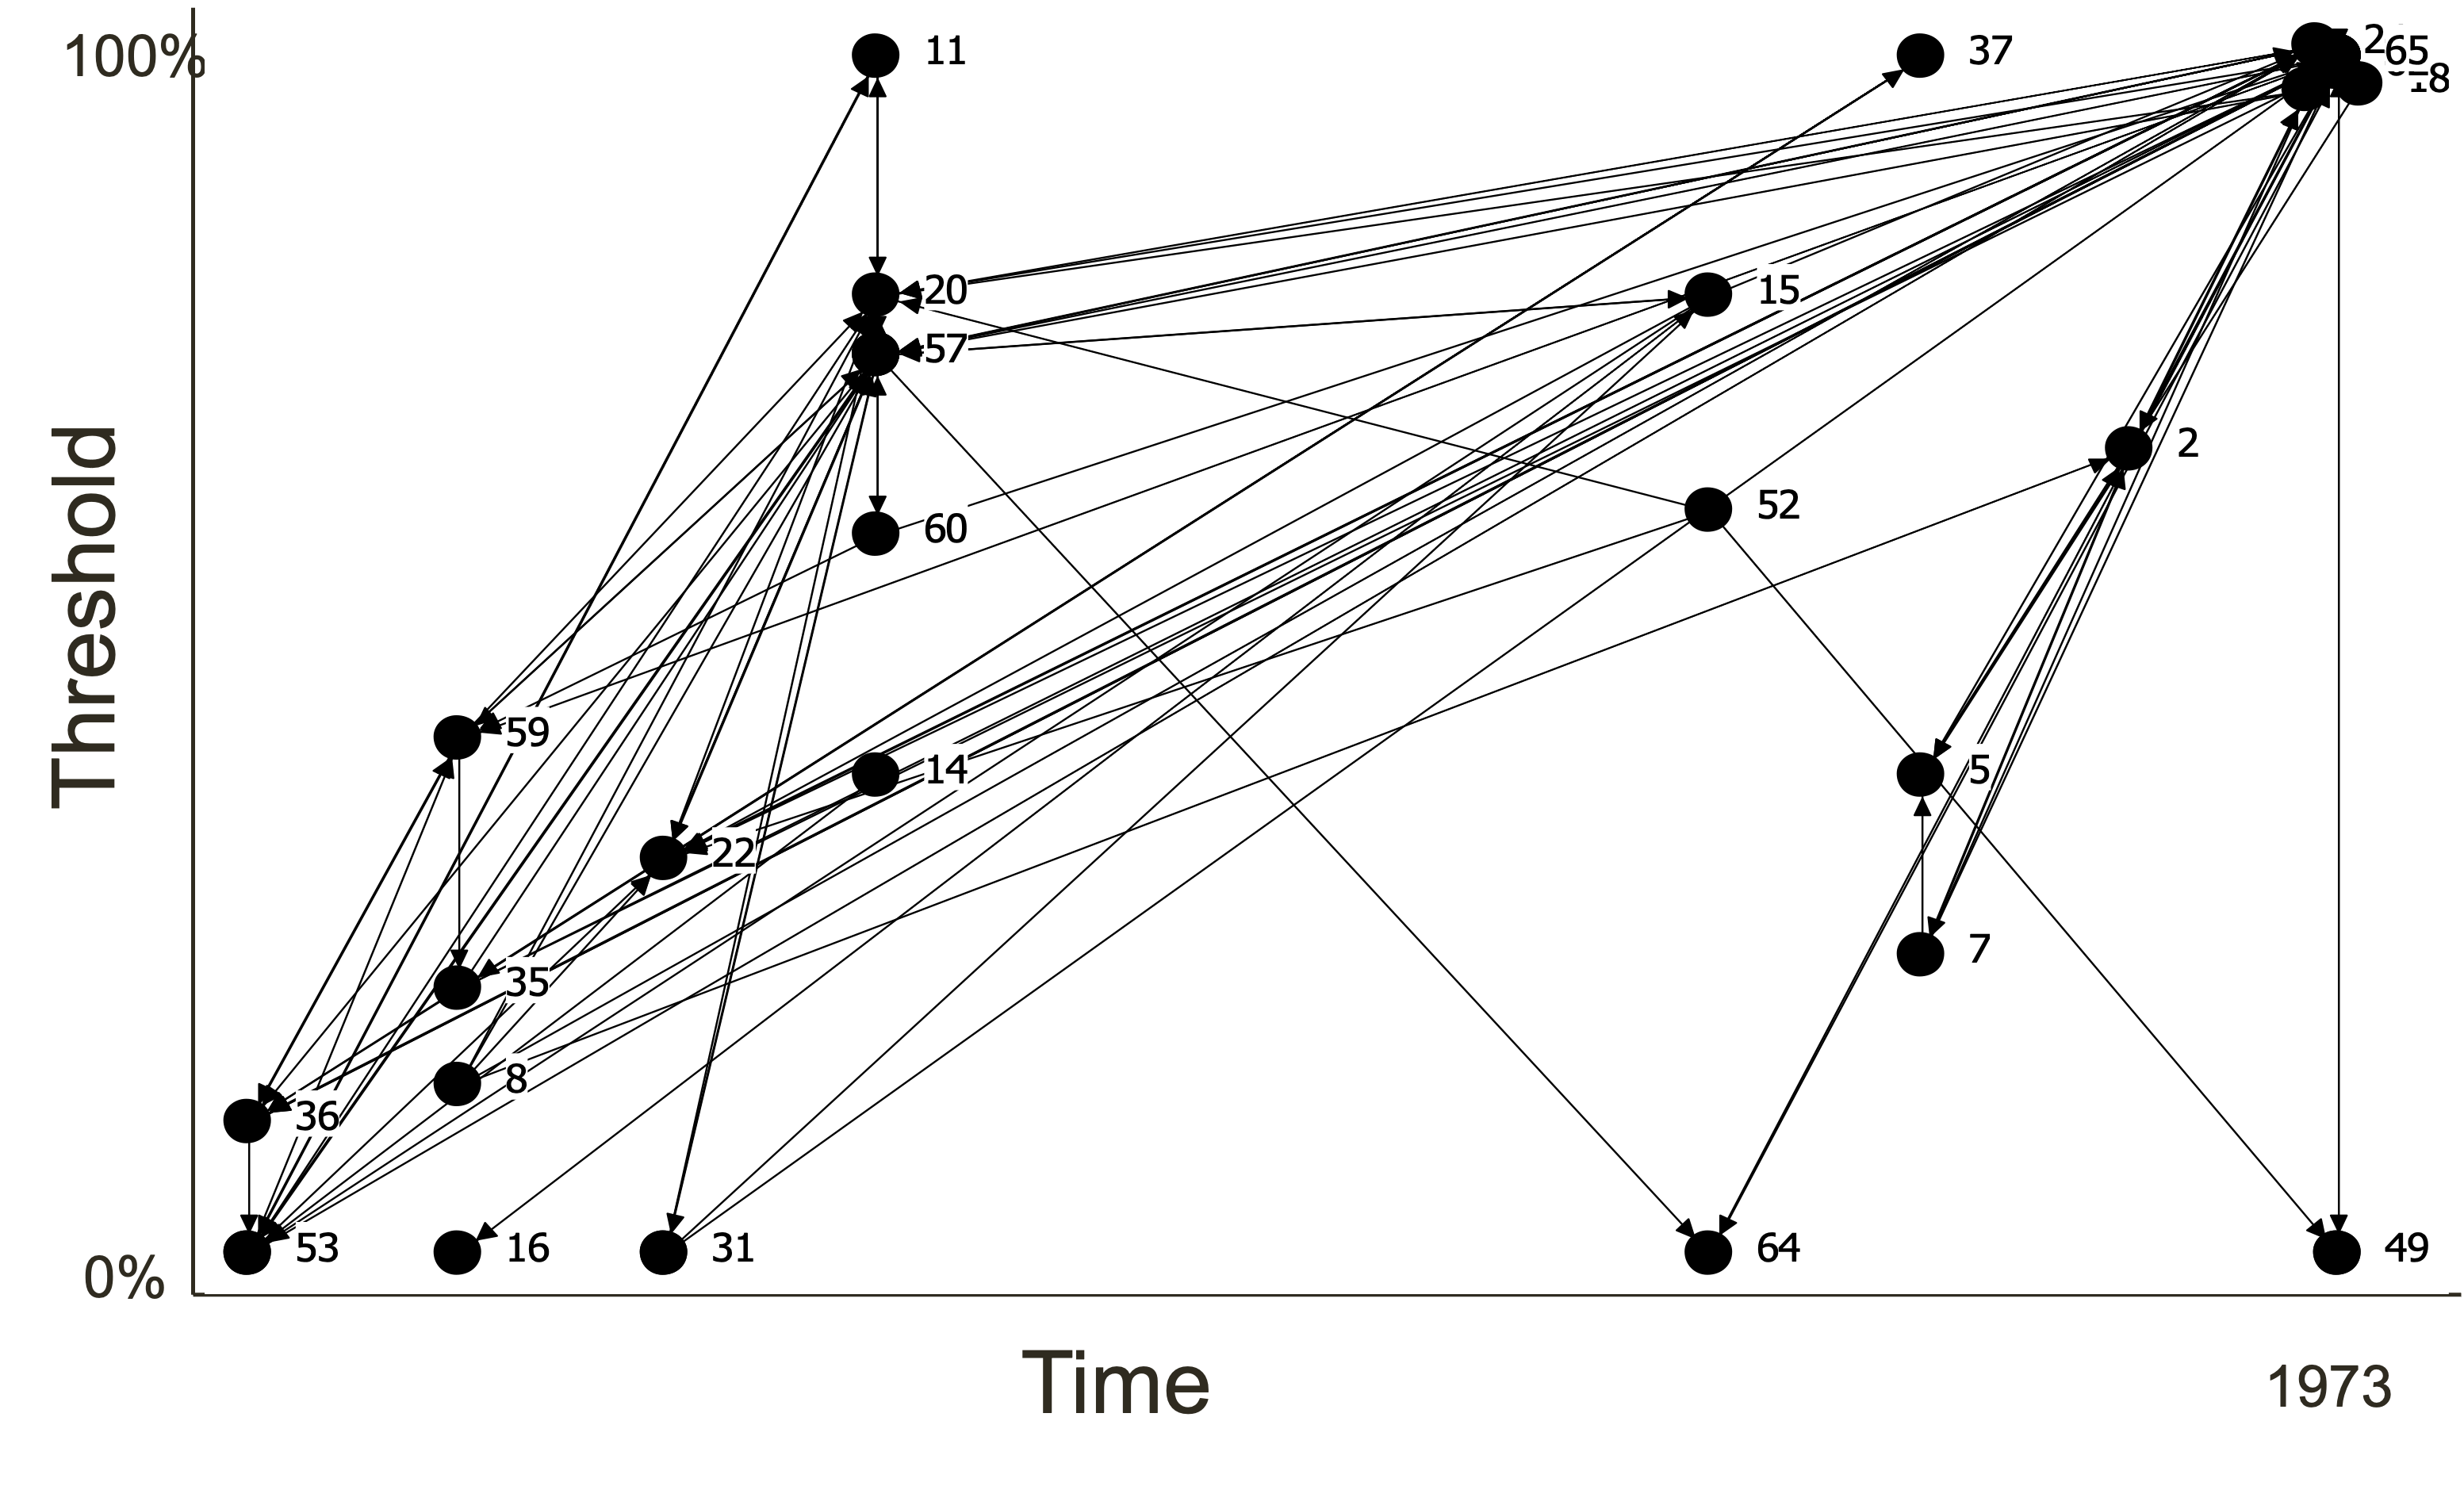
My article discovered network thresholds
Graph of Time of Adoption by Network Threshold for One Korean Family Planning Community
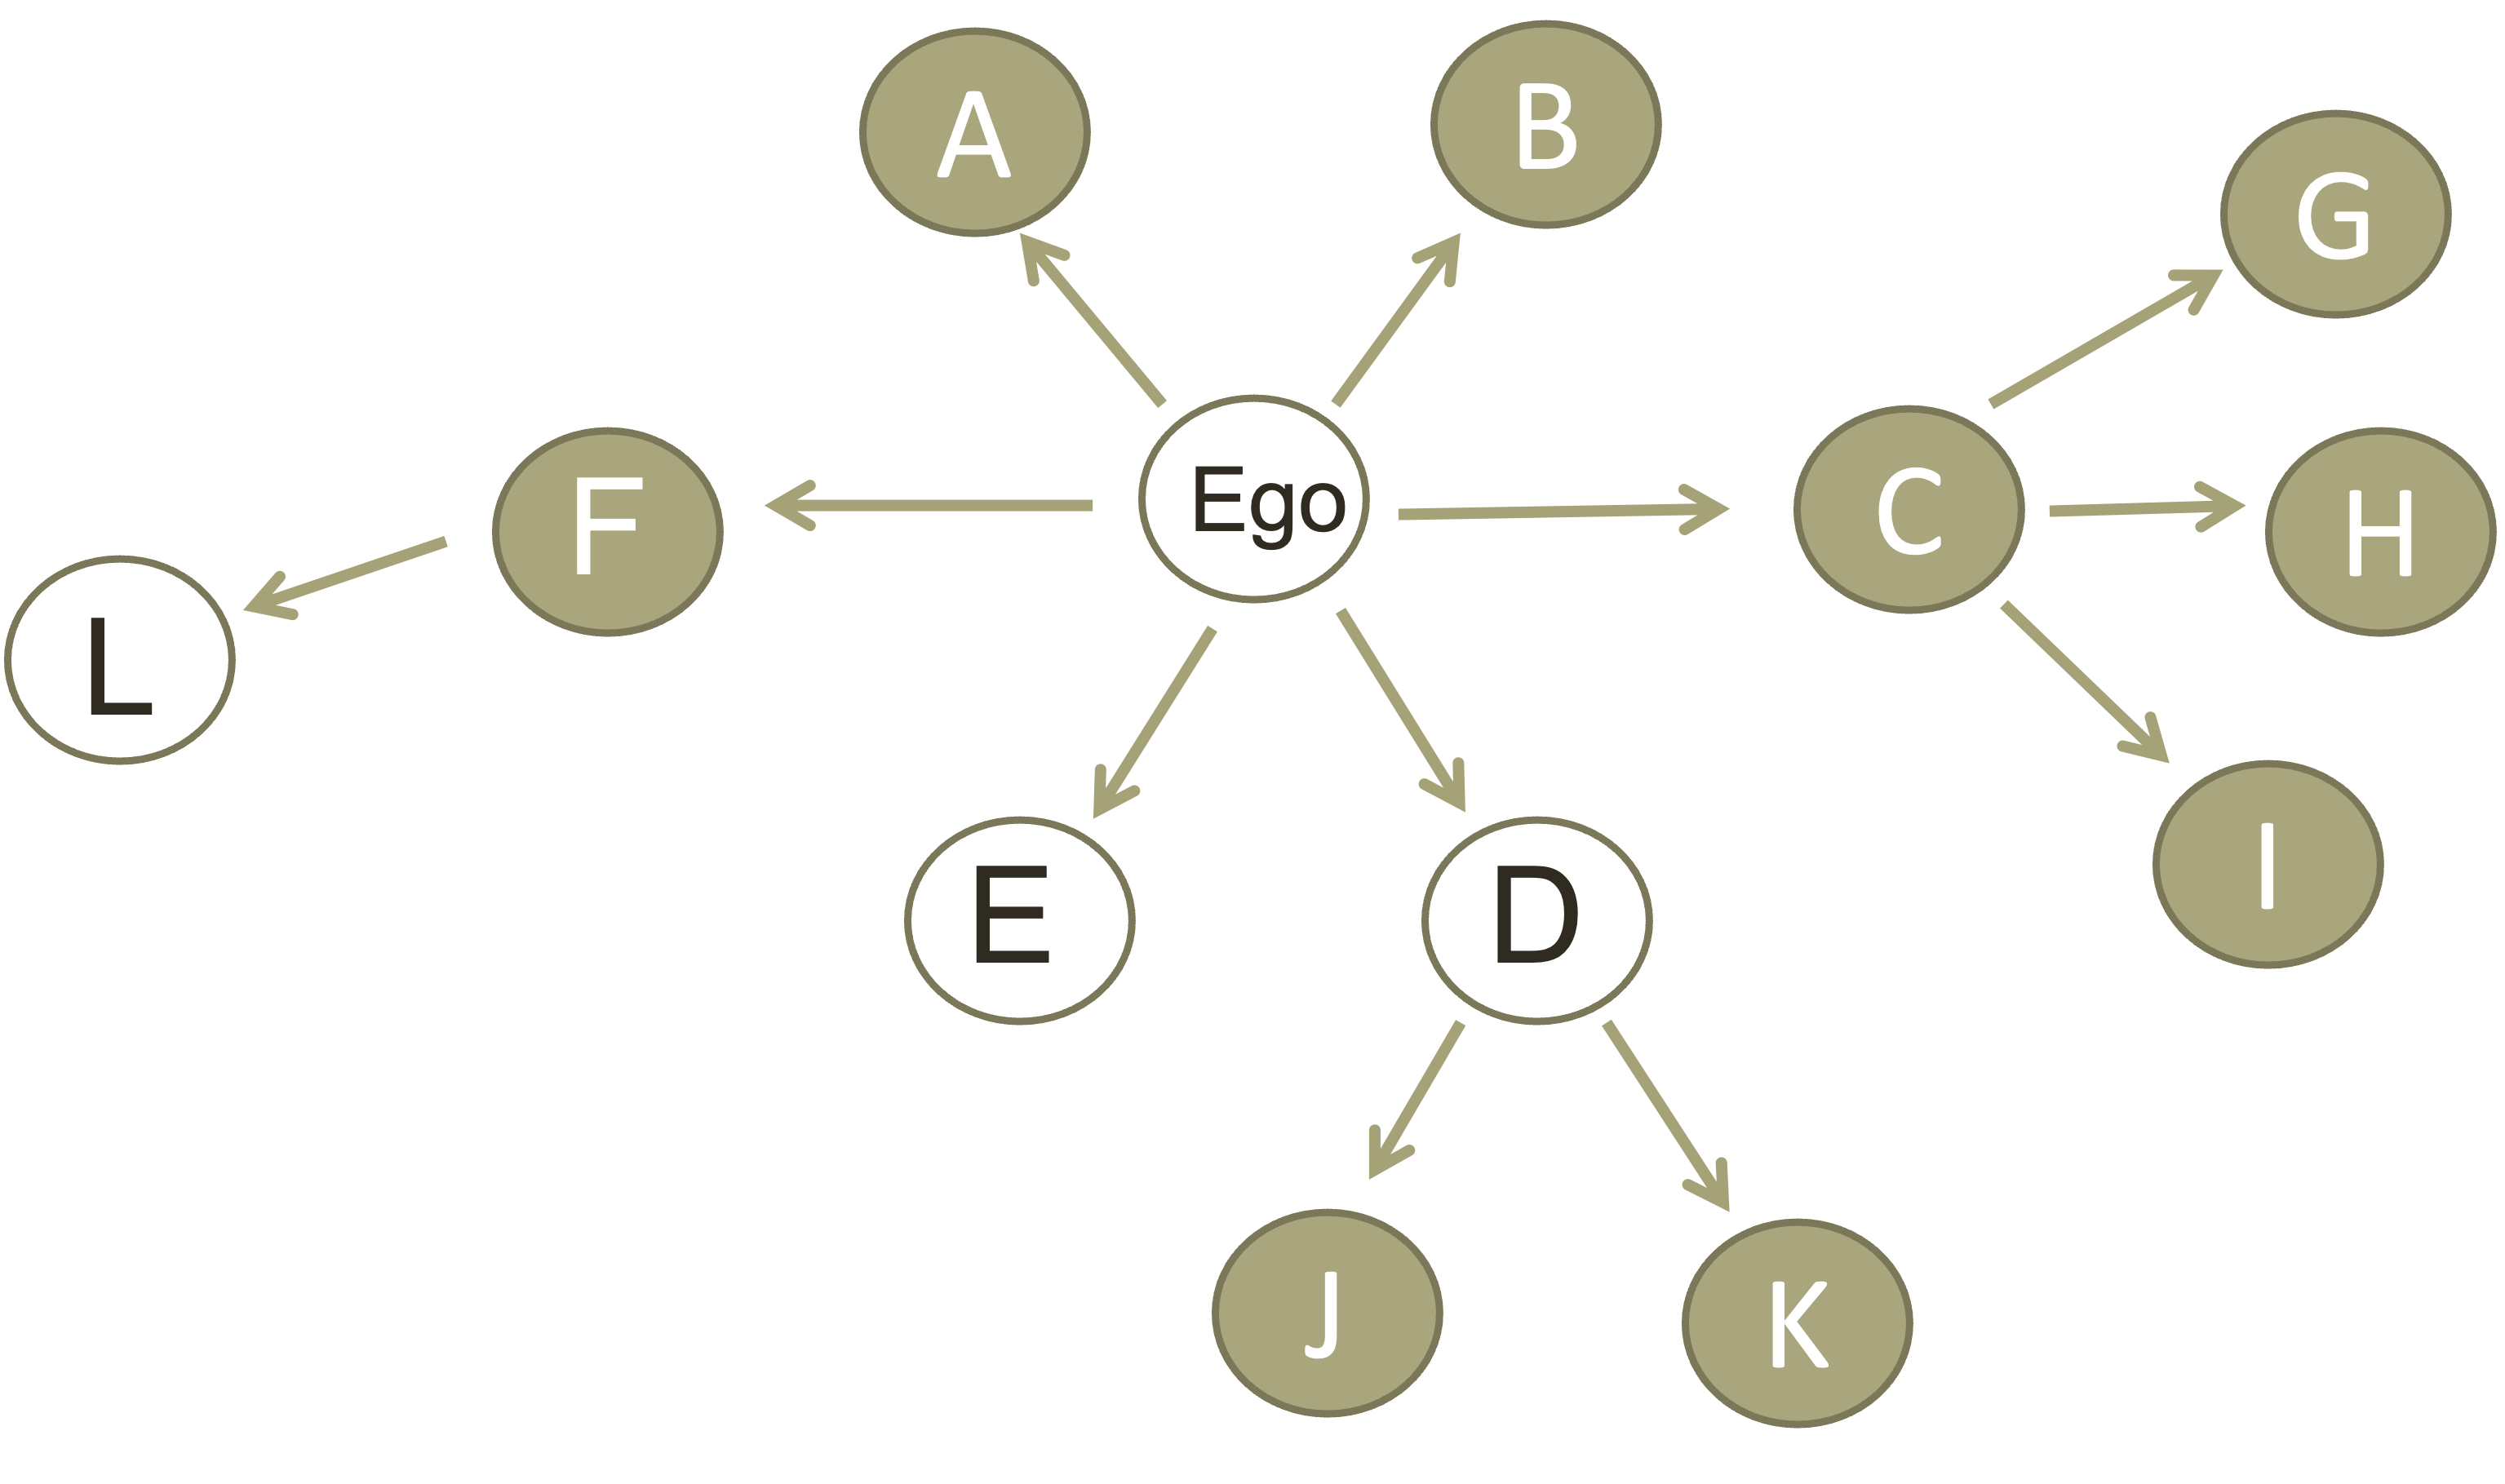
Indirect Exposures Matter
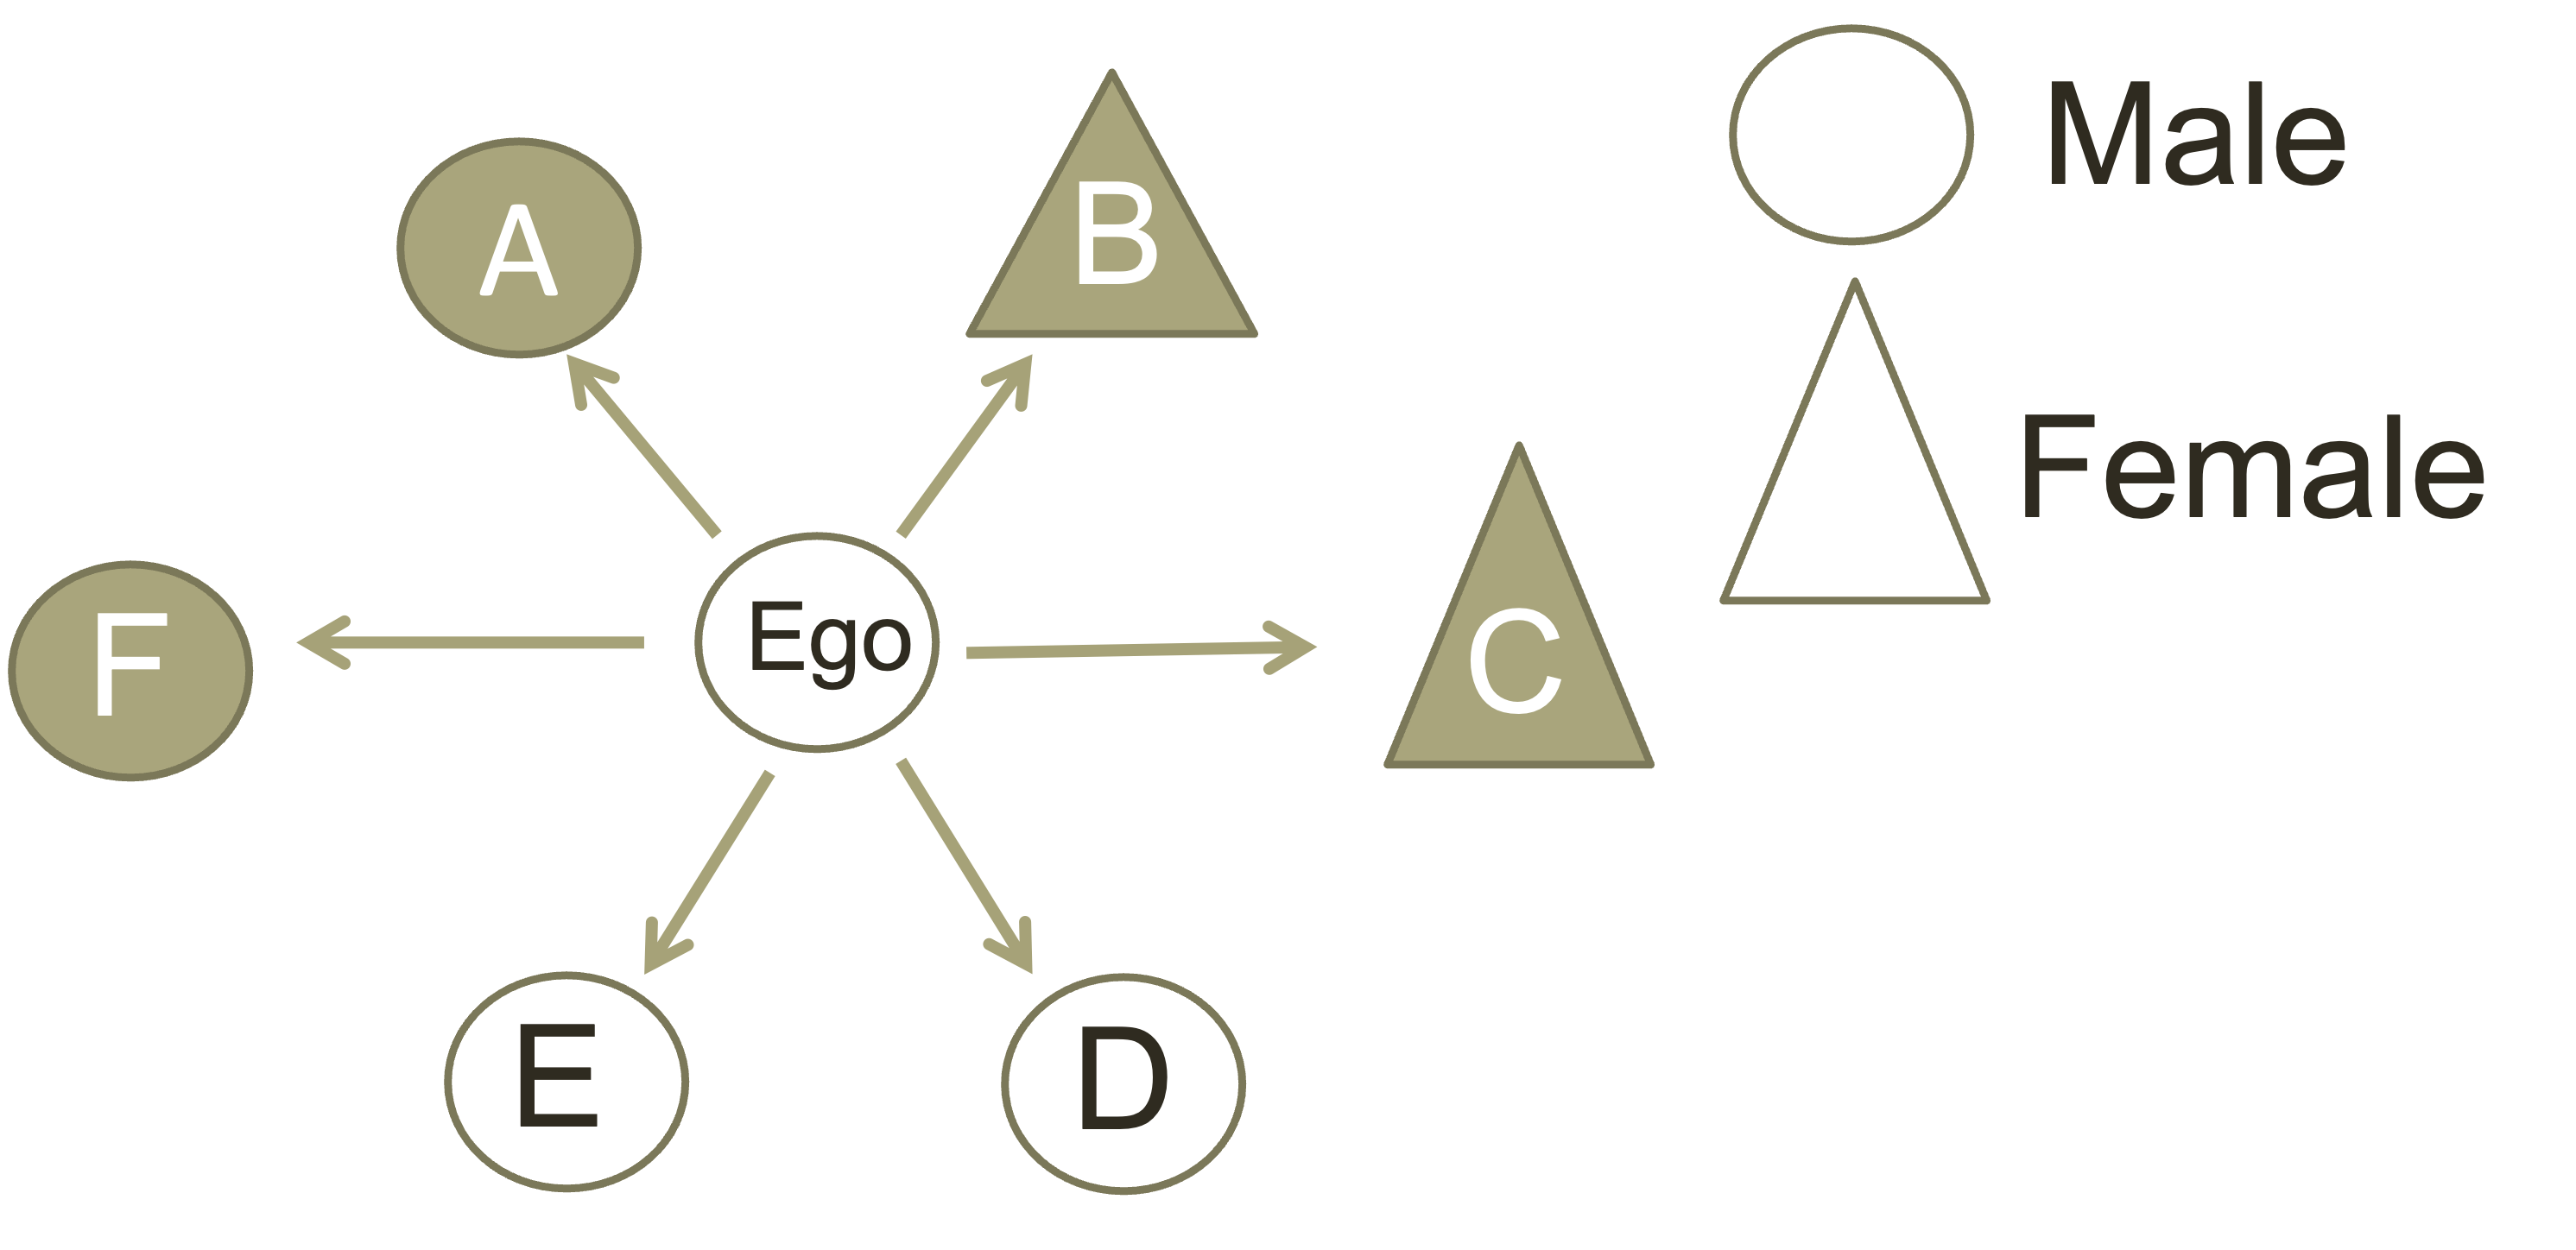
Alter Attributes May Affect Influence
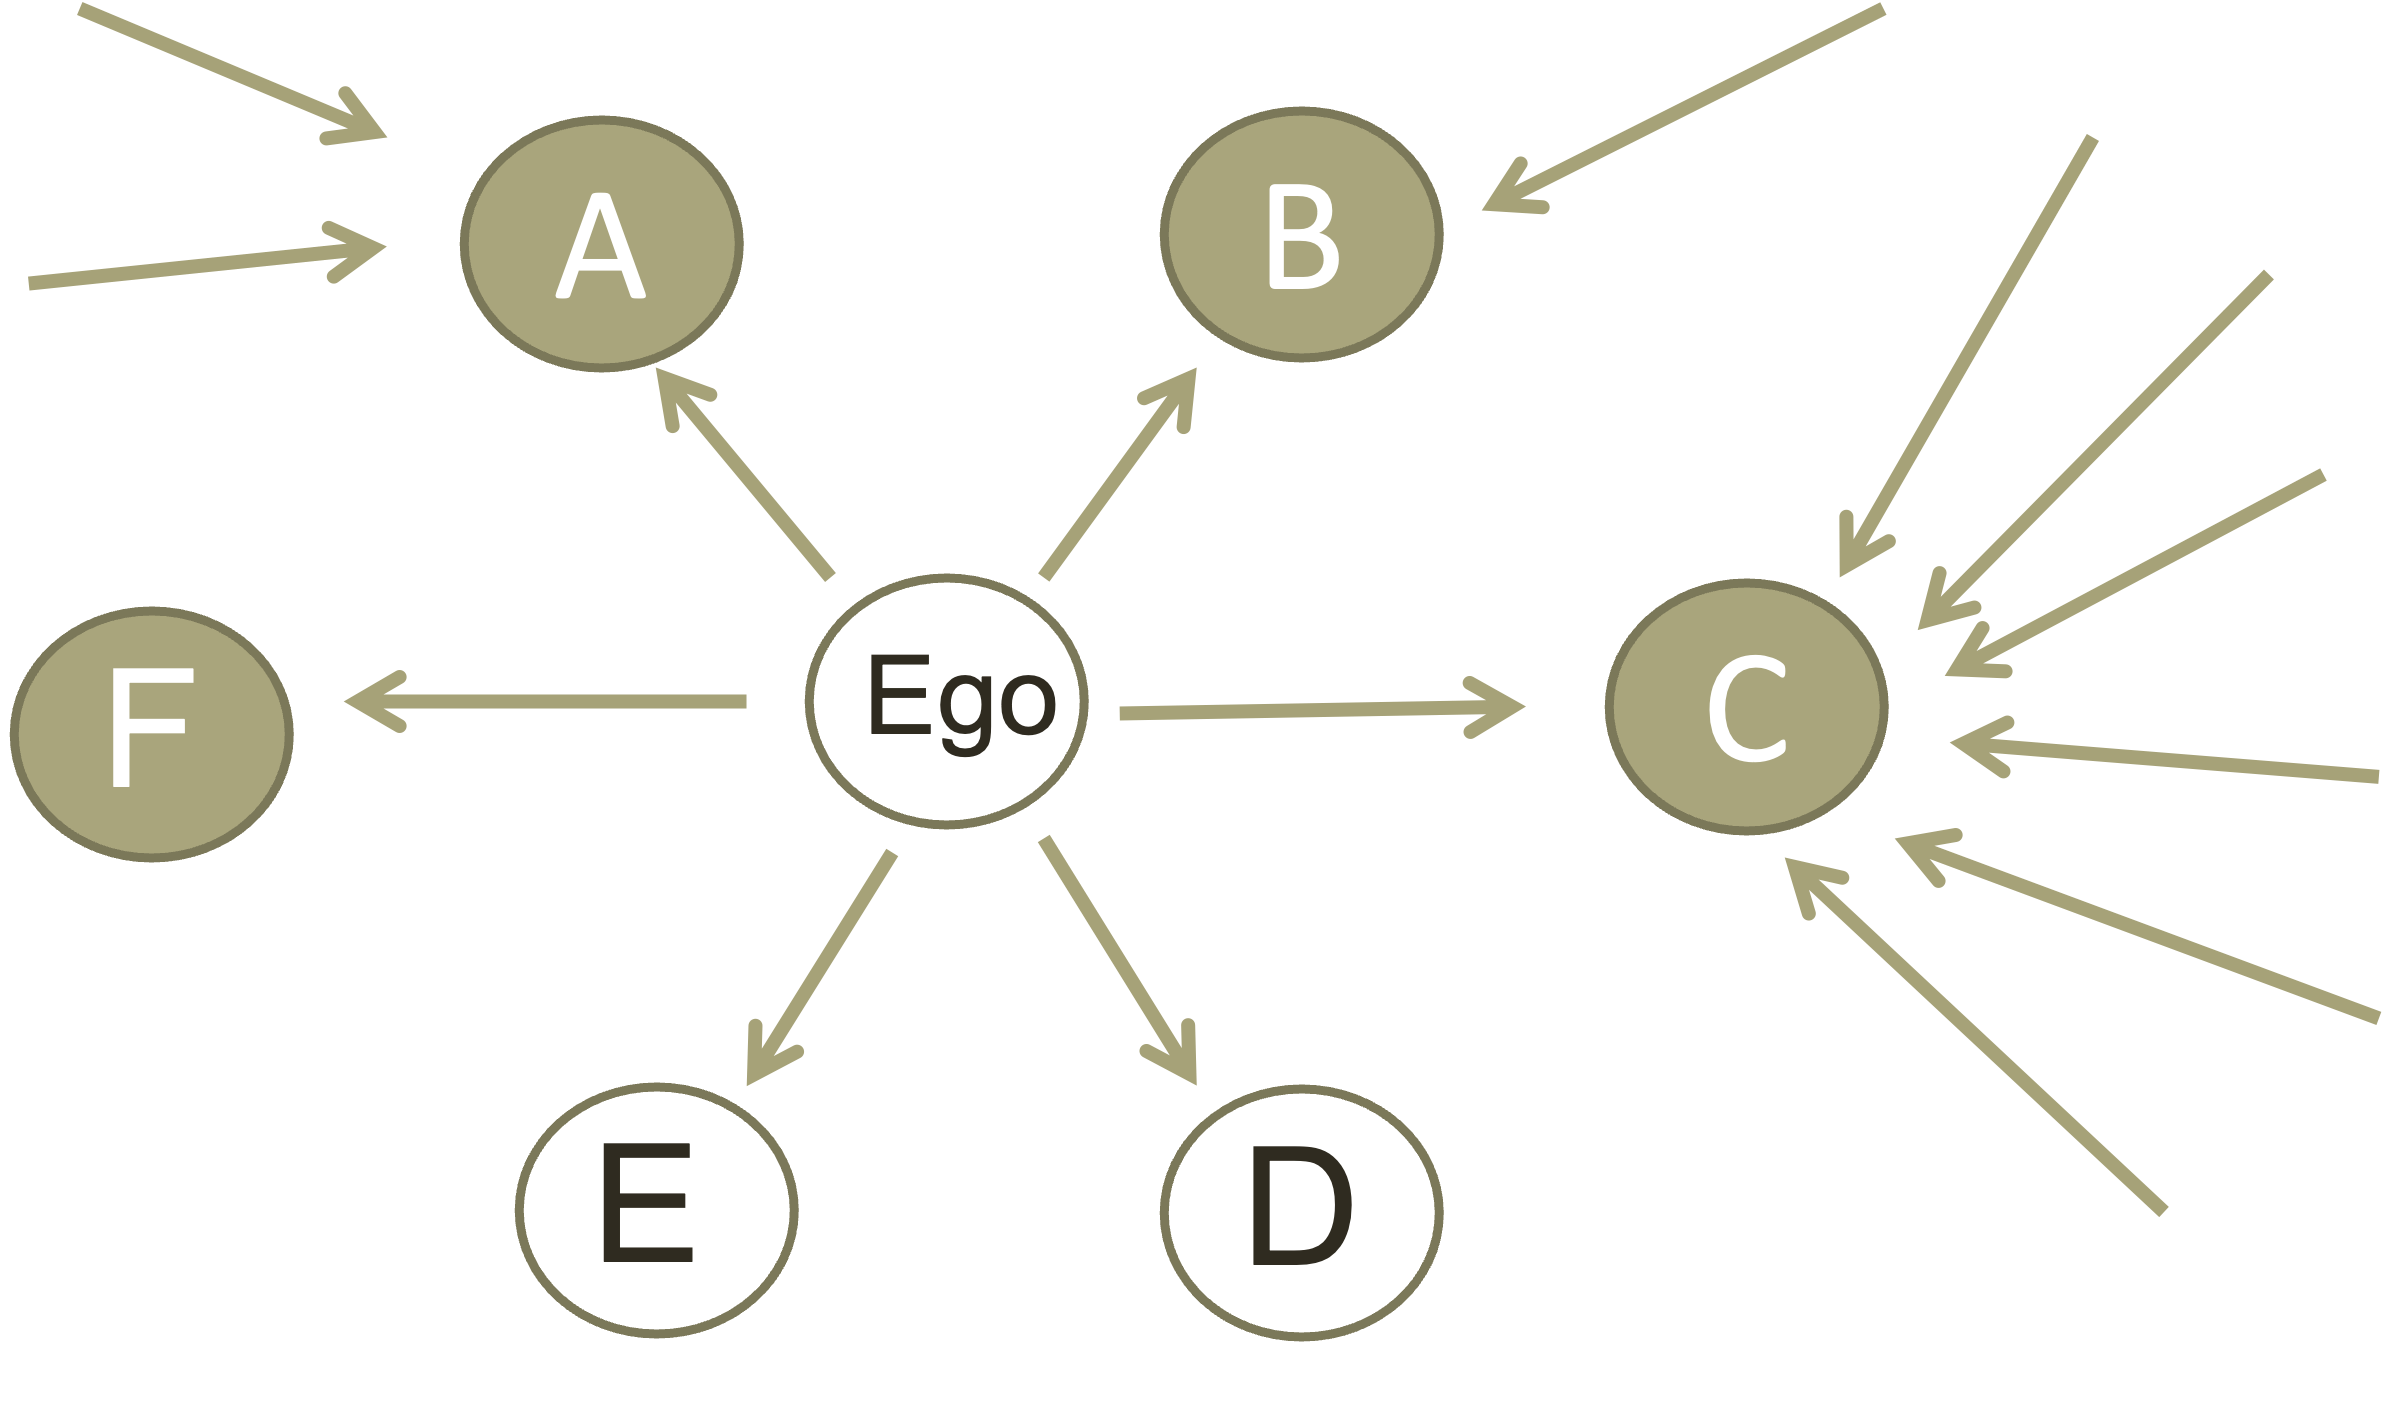
Centrality Weighted Exposures
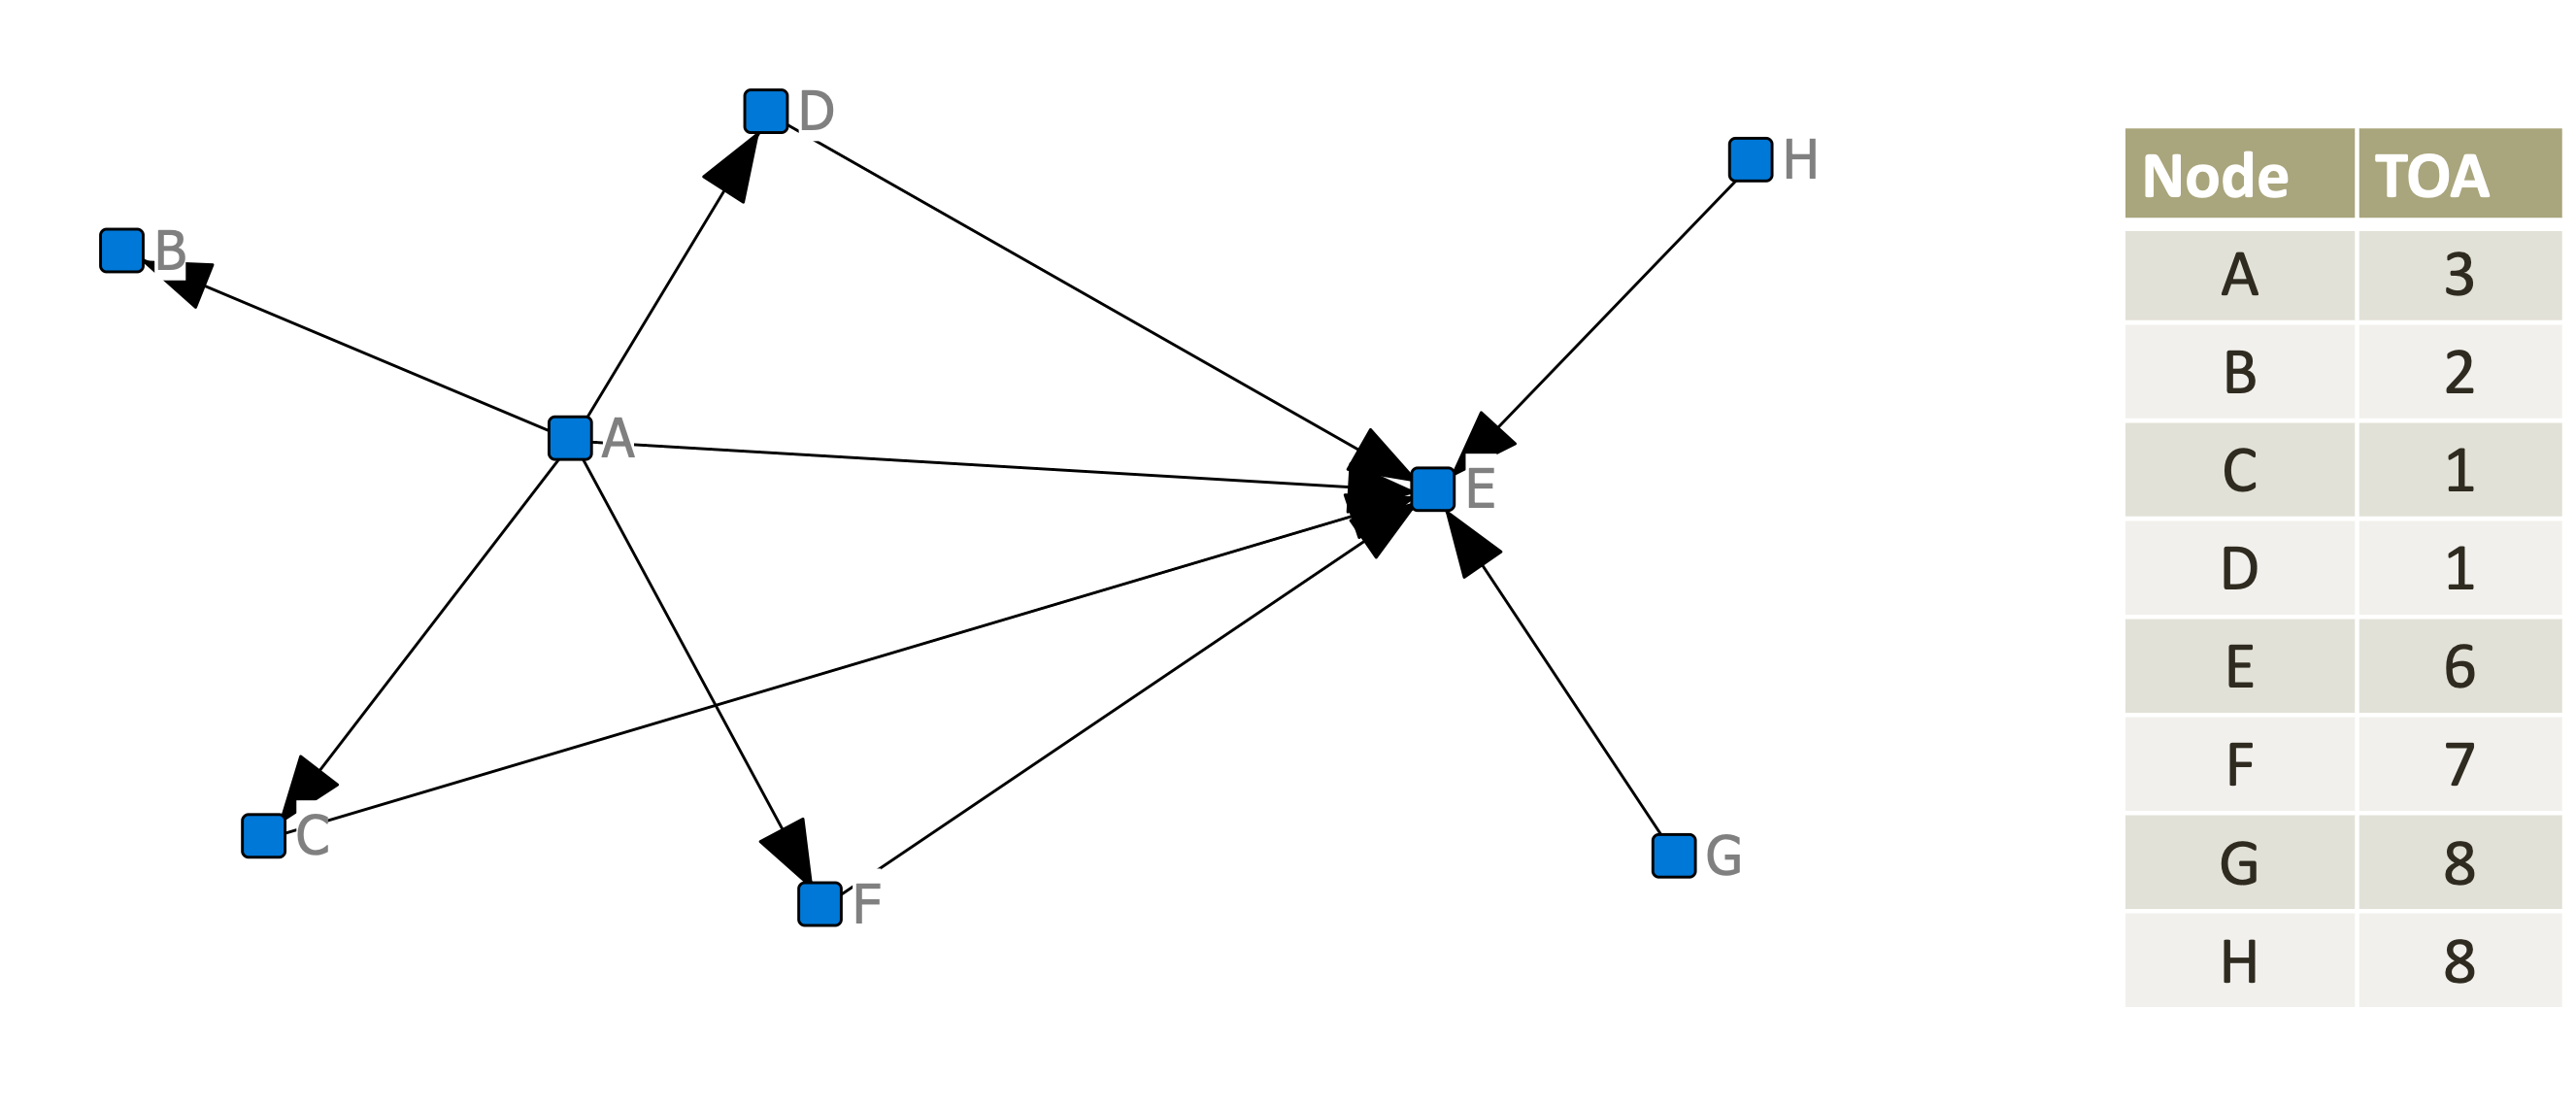
- Node A: Threshold=3/5, Susceptibility=1, Susc_Normed=1/3
- Node E: Impact 3/5, Infectiousness=1, Infect_Normed=1/3
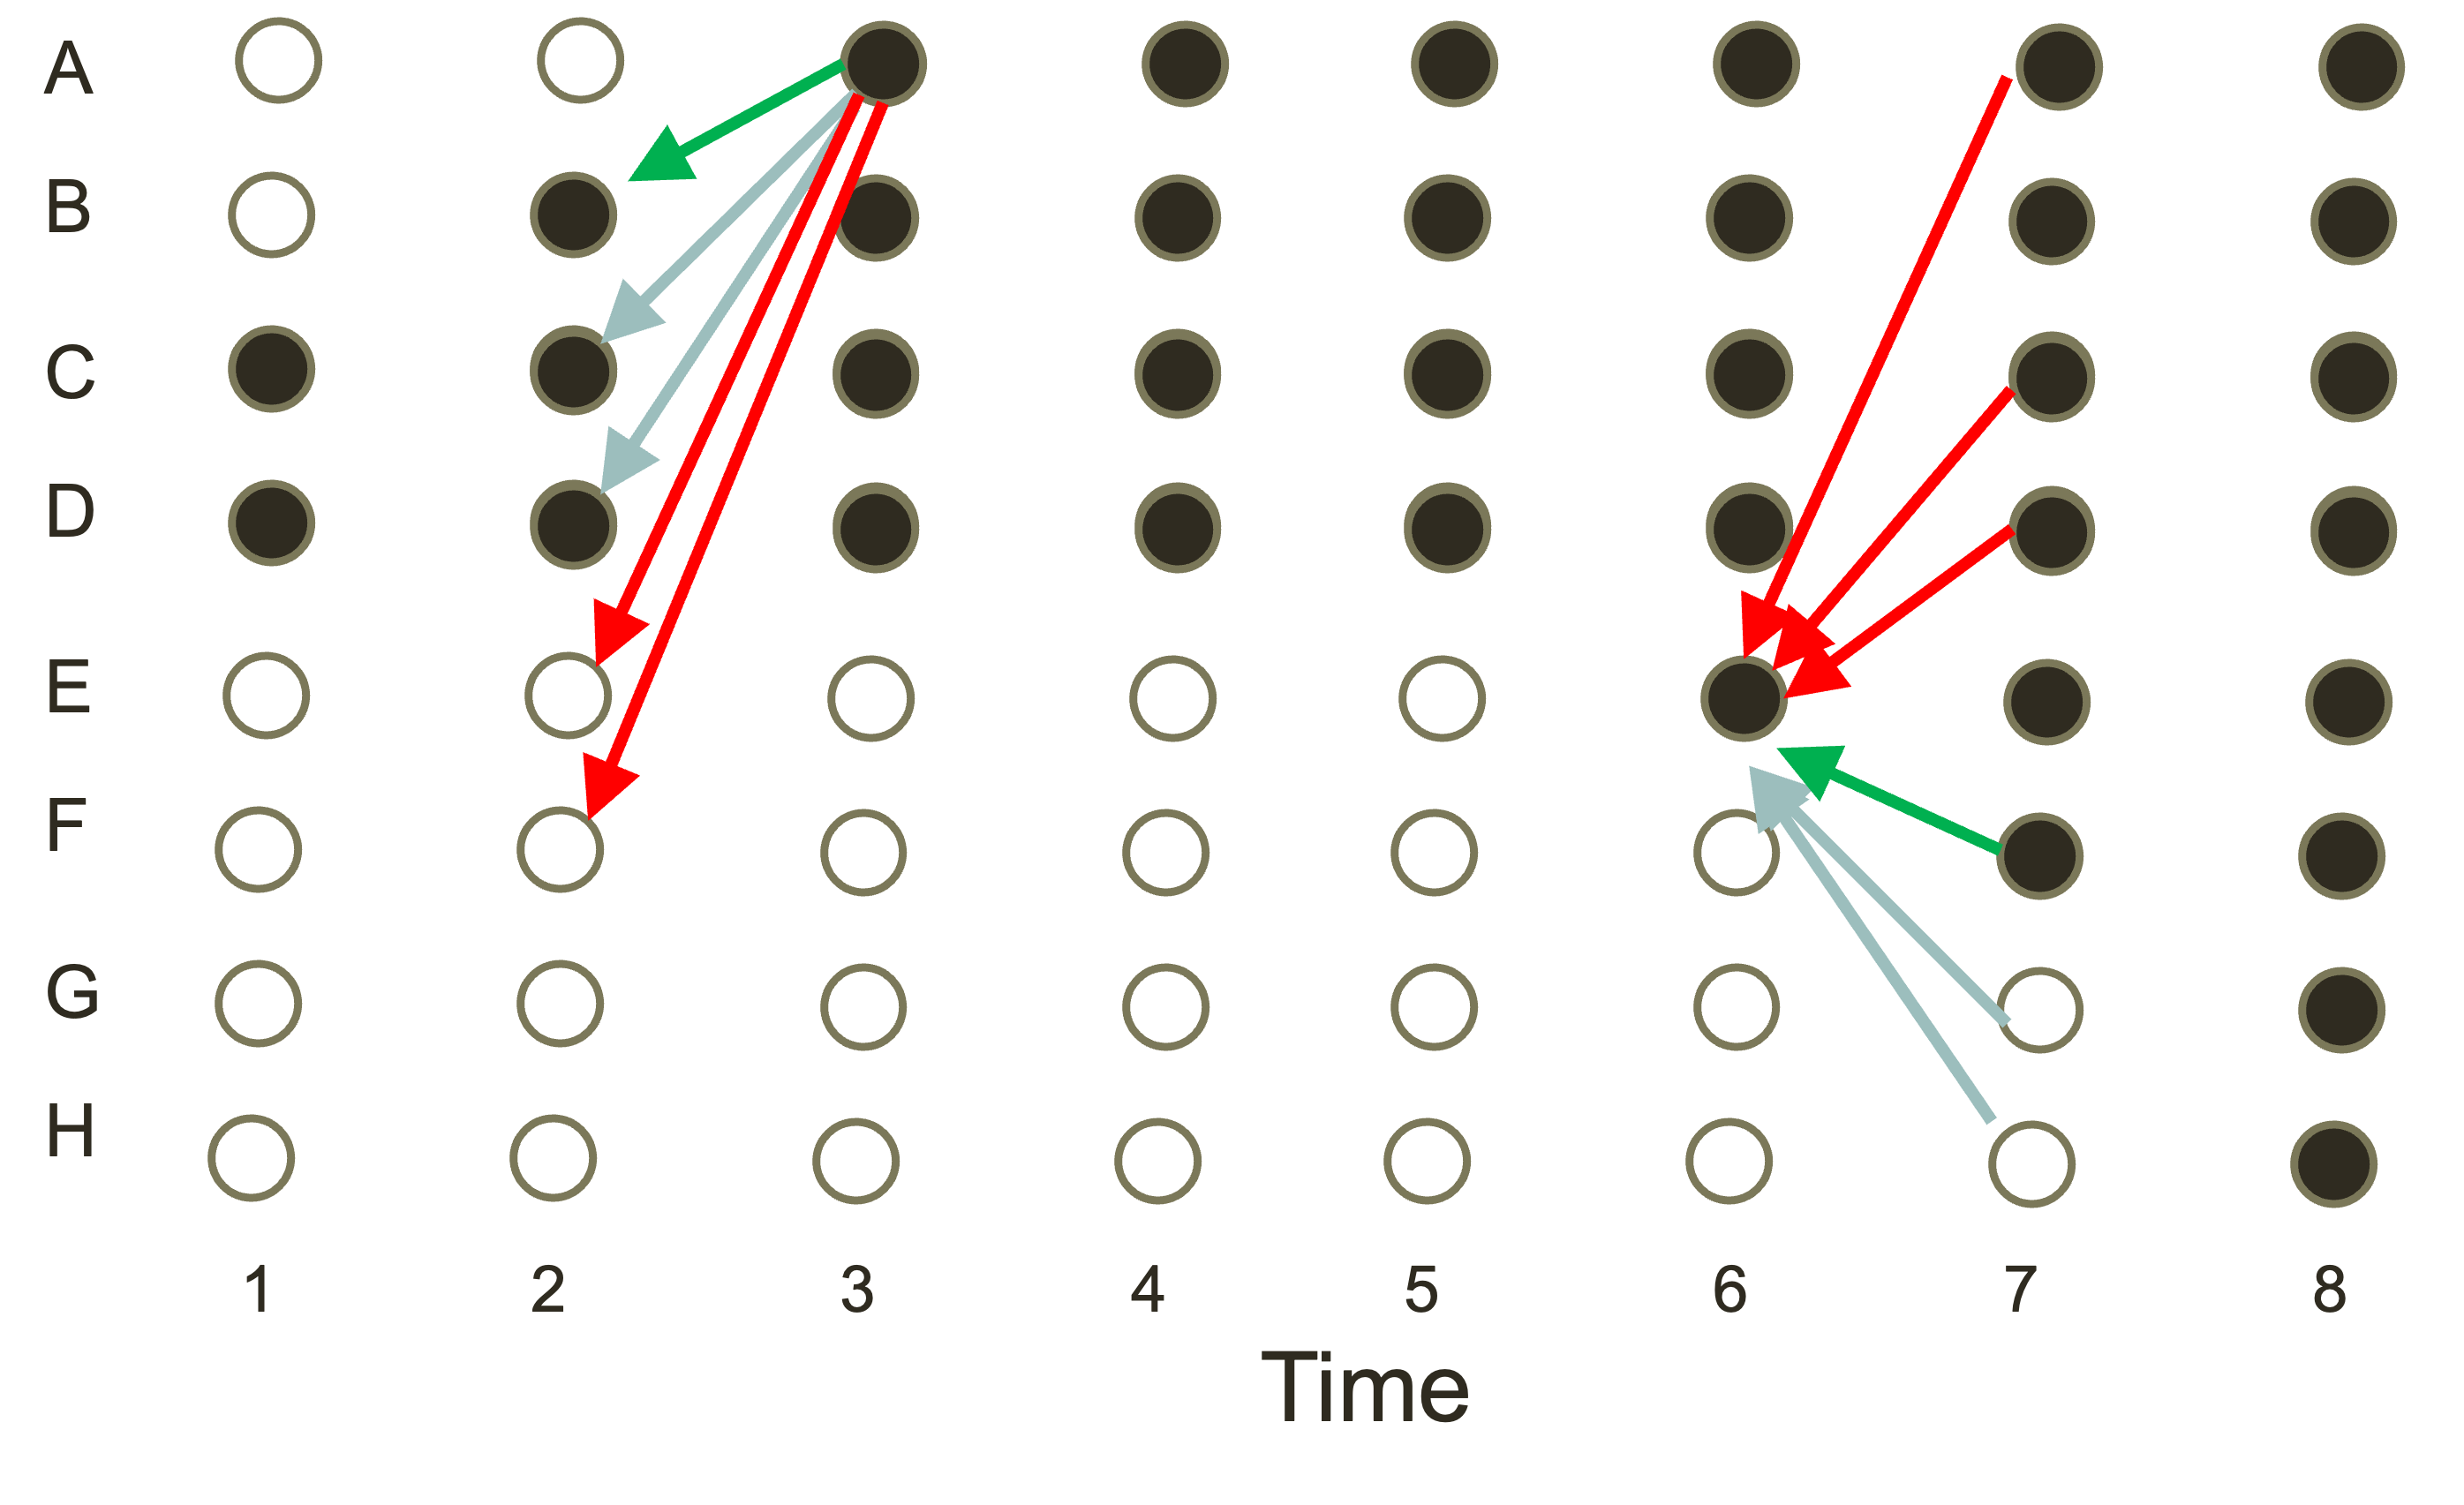
Other Features: Extending Exposure
Thresholds
Indirect exposures
Attribute weighted
Network weighted (i.e., centrality)
Infectiousness
Susceptibility
Ego-alter table
Graphing!
1995 Reported on the 3 Classic Studies
3 classic diffusion network datasets
MI: Medical Innovation
BF: Brazilian Farmers
KFP: Korean Family Planning
Diffusion Curves for Classic Studies
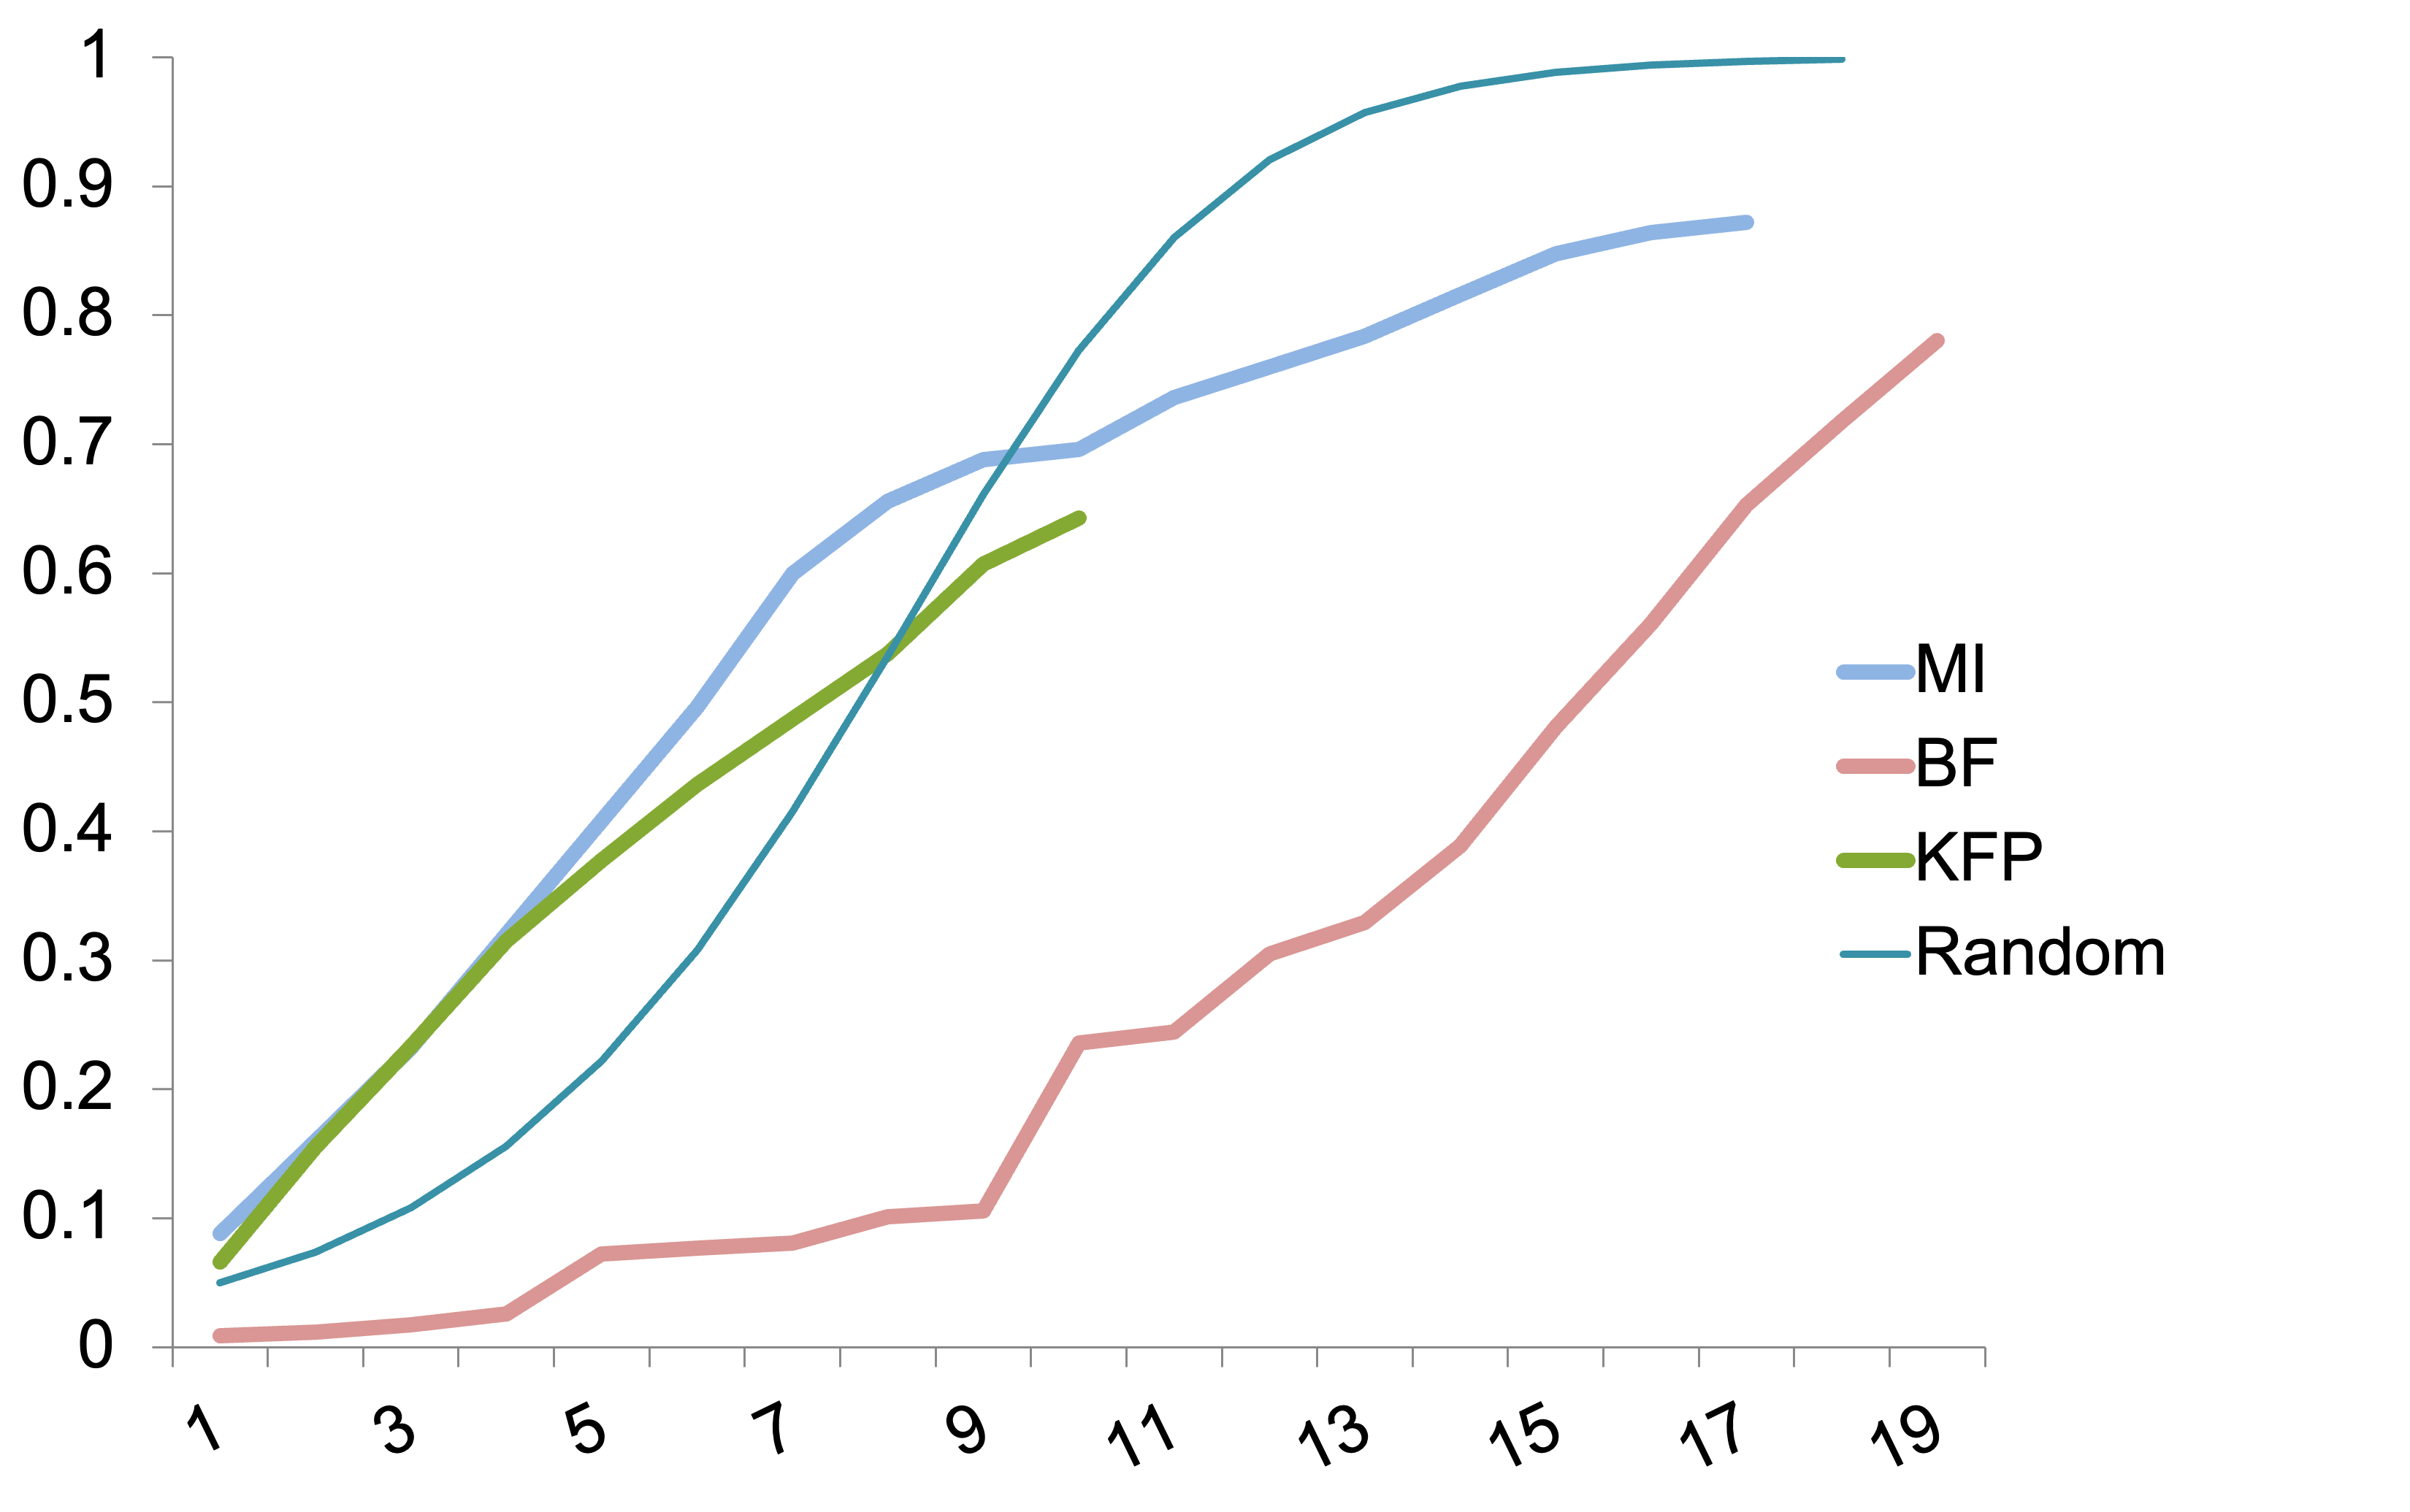
6 Diffusion Network Studies 3 Early Studies Lost
Rogers’ dissertation on 2-4D Weed Spray
Rogers’ work in Colombia
Becker’s study of public health officers in New York, Ohio, and Michigan (compared 2 innovations)
3 Classic Diffusion Network Studies
| Medical Innovation | Korean Family Planning | Brazilian Farmers | |
|---|---|---|---|
| Country | USA | Korean | Brazil |
| # Respondents | 125 Doctors | 1,047 Women | 692 Farmers |
| # Communities | 4 | 25 | 11 |
| Innovation | Tetracycline | Family Planning | Hybrid Corn Seed |
| Time for Diffusion | 18 Months | 11 Years | 20 Years |
| Year Data Collected | 1955 | 1973 | 1966 |
| Ave. Time to 50% | 6 | 7 | 16 |
| Highest Saturation | 89% | 83% | 98% |
| Lowest Saturation | 81% | 44% | 29% |
| Citation | Coleman et al (1996) | Rogers & Kincaid (1981) | Rogers et al (1970) |
Reconfigure to Event History Data
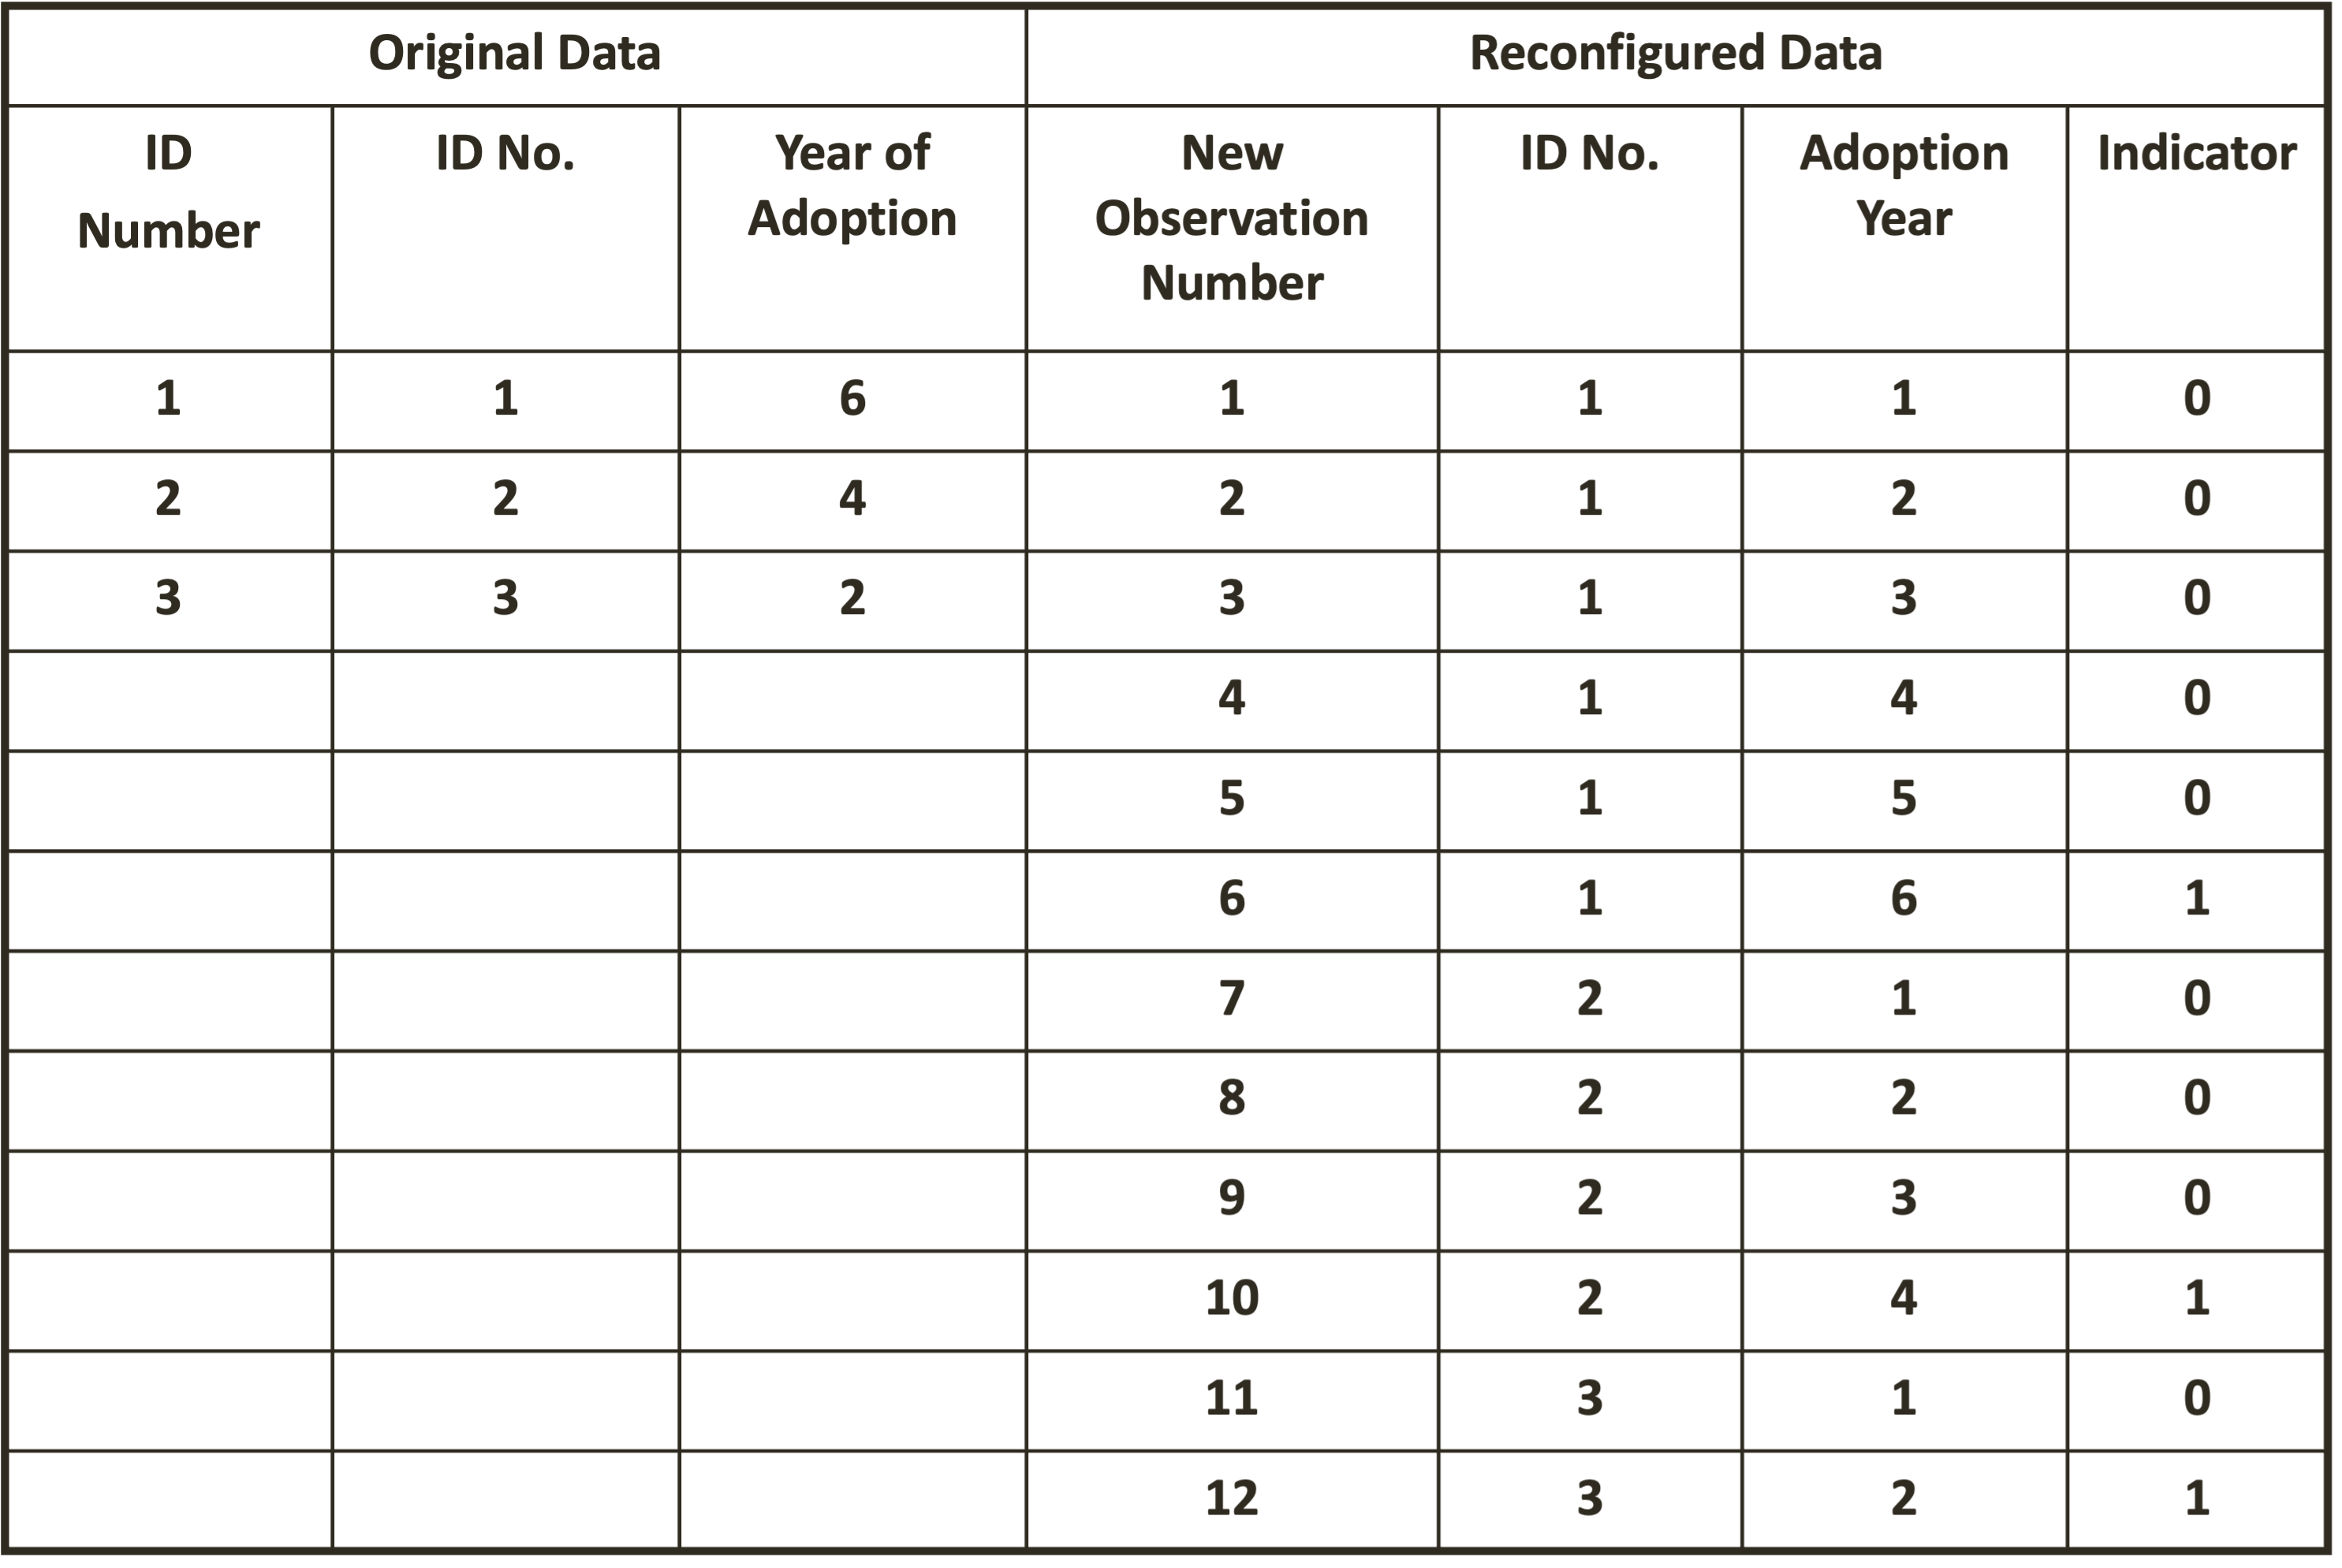
Medical Innovation (Coleman, Katz, & Menzel, 1966),
Data collected from physicians in the 4 cities in Illinois in 1955 (Galesburg, Bloomington, Quincy, & Peoria). 125 MDs interviewed about the medical practice characteristics:
3 network questions: advice, discussion, and friends.
Adoption data collected by analyzing the prescription records of local pharmacies on the first 3 days of each month.
Brazilian Farmers (Rogers, Ascroft, & Röling, 1970)
As part of the USAID funded 3-country study, farmers in selected villages in India, Nigeria, and Brazil were interviewed about their farming practices, use of media, and other personal characteristics. Networks were measured by asking:
their three best friends, (2) the three most influential people in their community, (3) the three most influential people regarding various farm innovations, and (4) the best person to organize a cooperative project.
Adoption data were collected by asking farmers when they first planted hybrid seed corn
Korean Family Planning (Rogers & Kincaid, 1981)
Scholars at Seoul National University’s School of Public Health collected data on the adoption of family planning methods among all married women of child-bearing age in 25 Korean villages in 1973 (N=1,047). Networks Network data were obtained by asking respondents to name five people from whom
- they sought advice about (1) family planning, (2) general information,
- abortion, (4) health, (5) the purchase of consumer goods, and (6) children’s education.
- Adoption data were obtained by asking respondents to state the year they first used a modern family planning method.
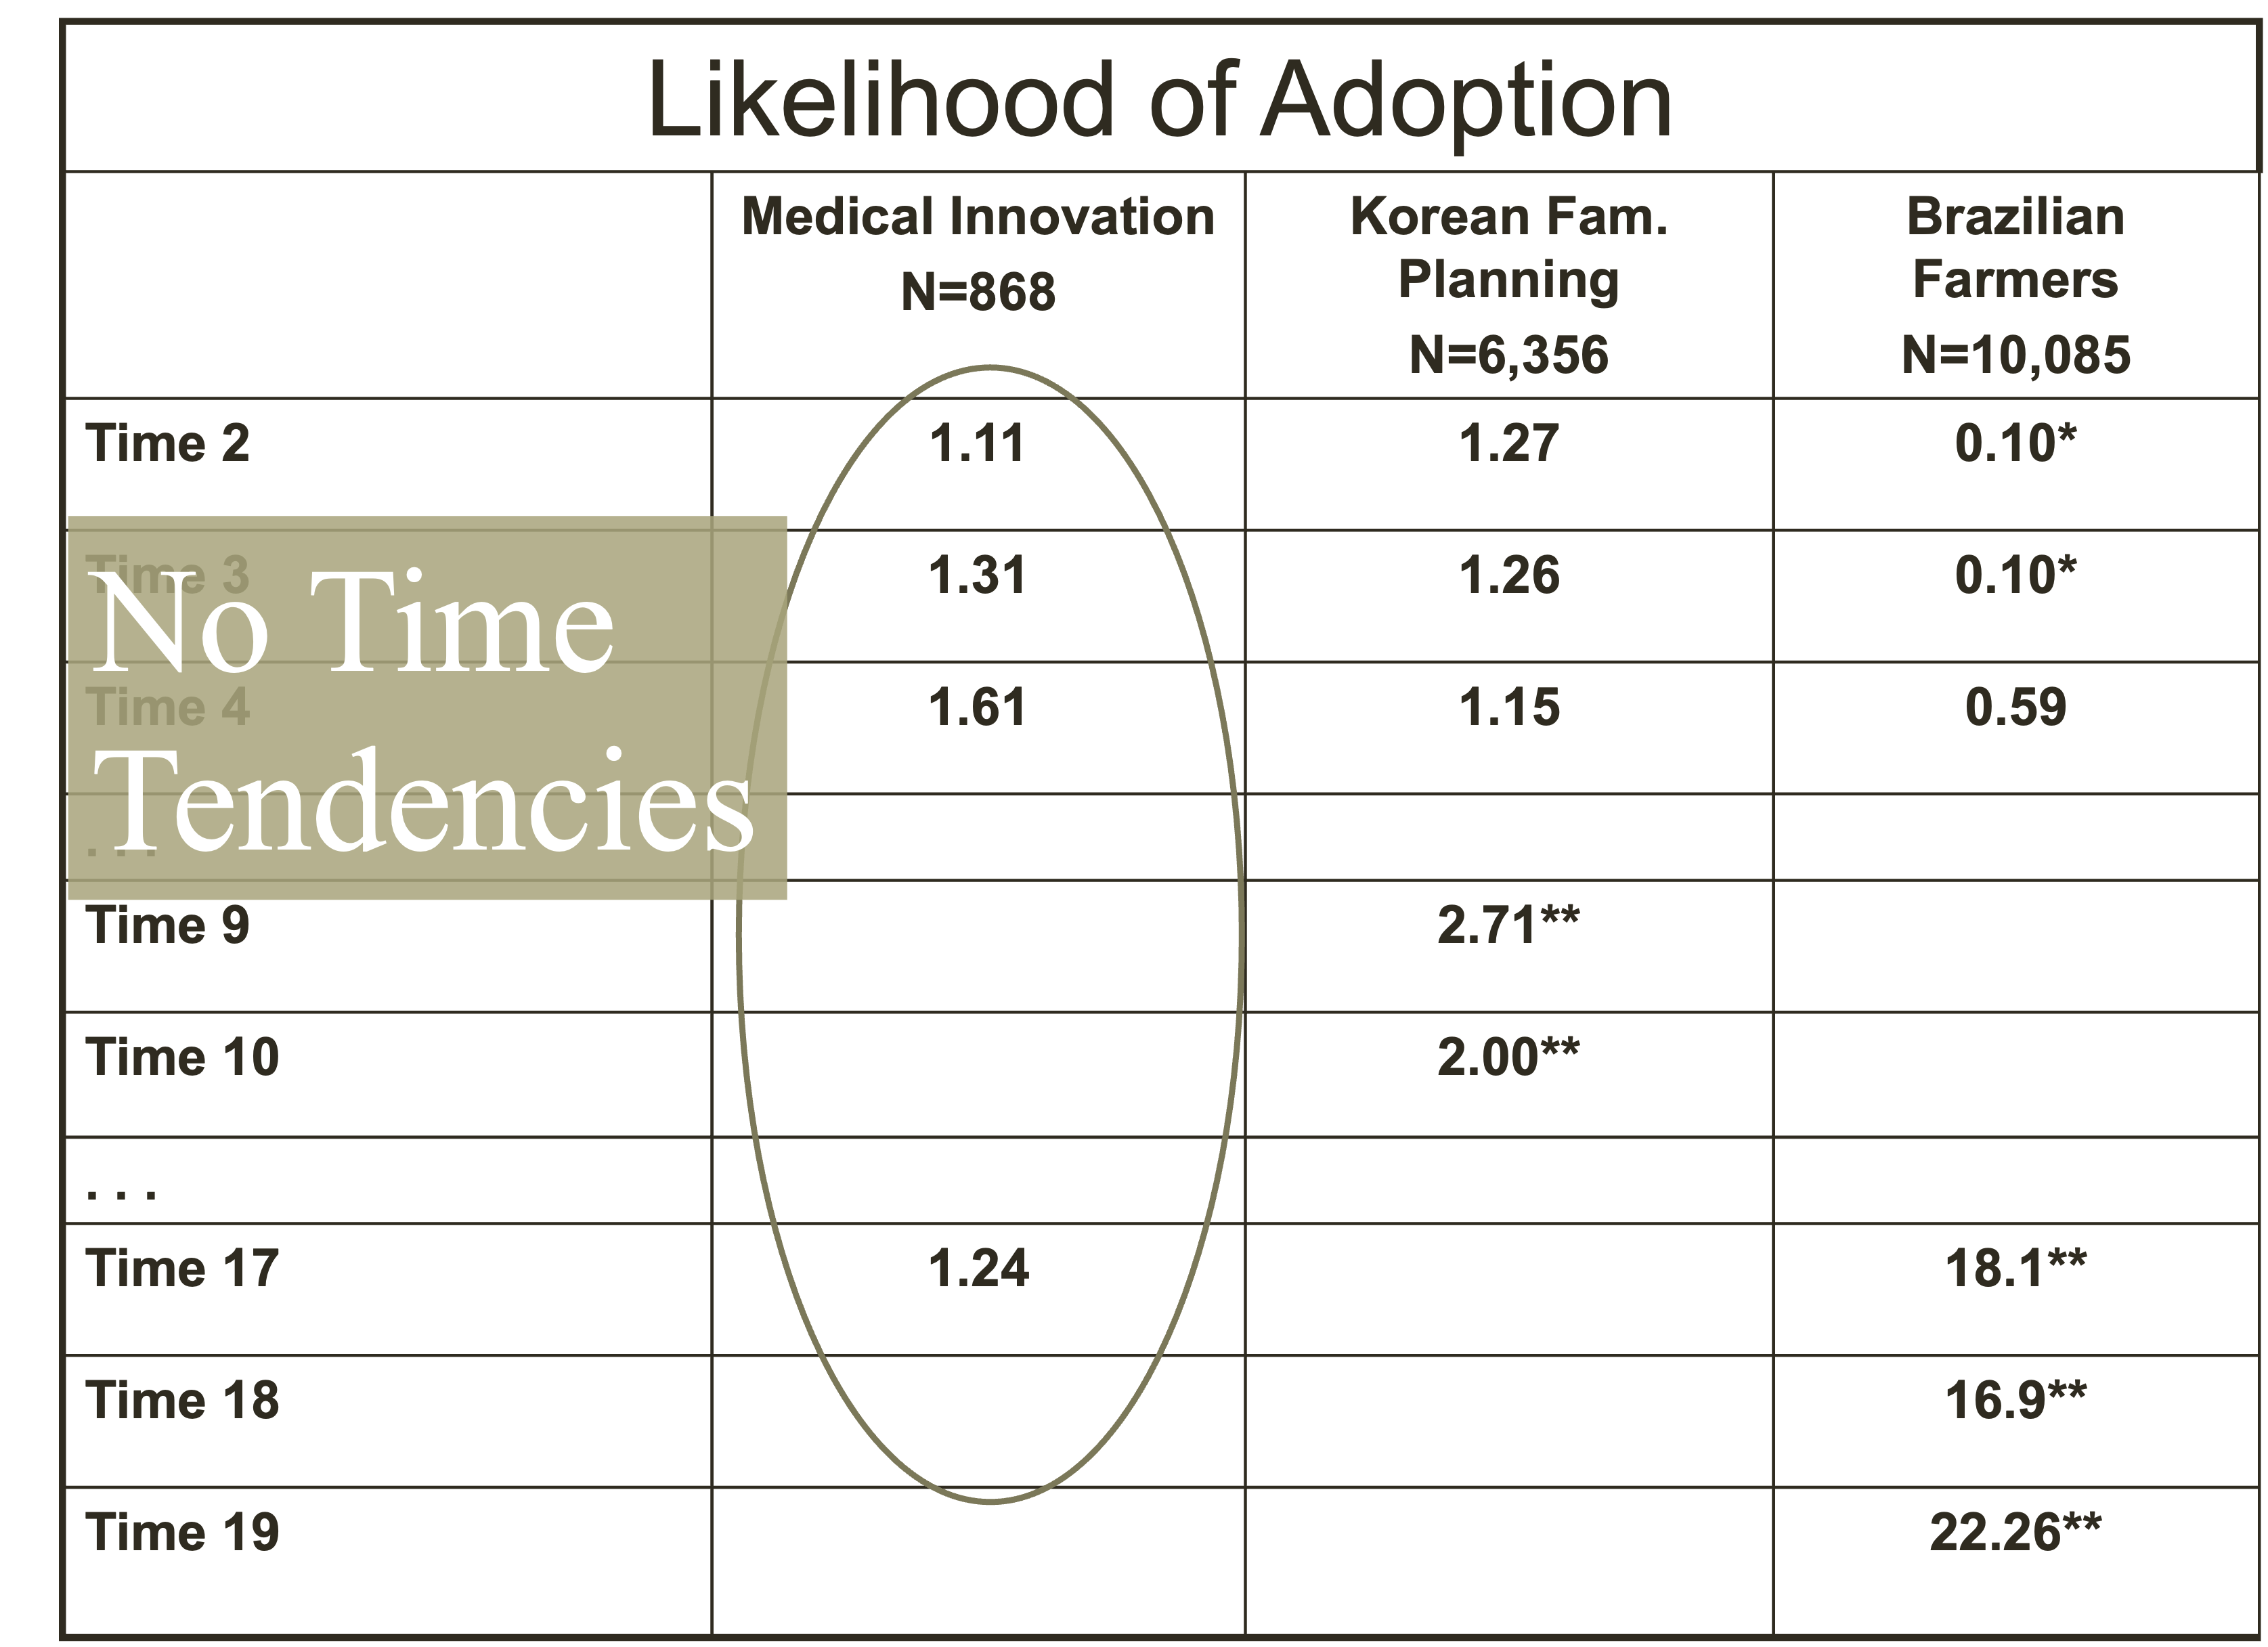
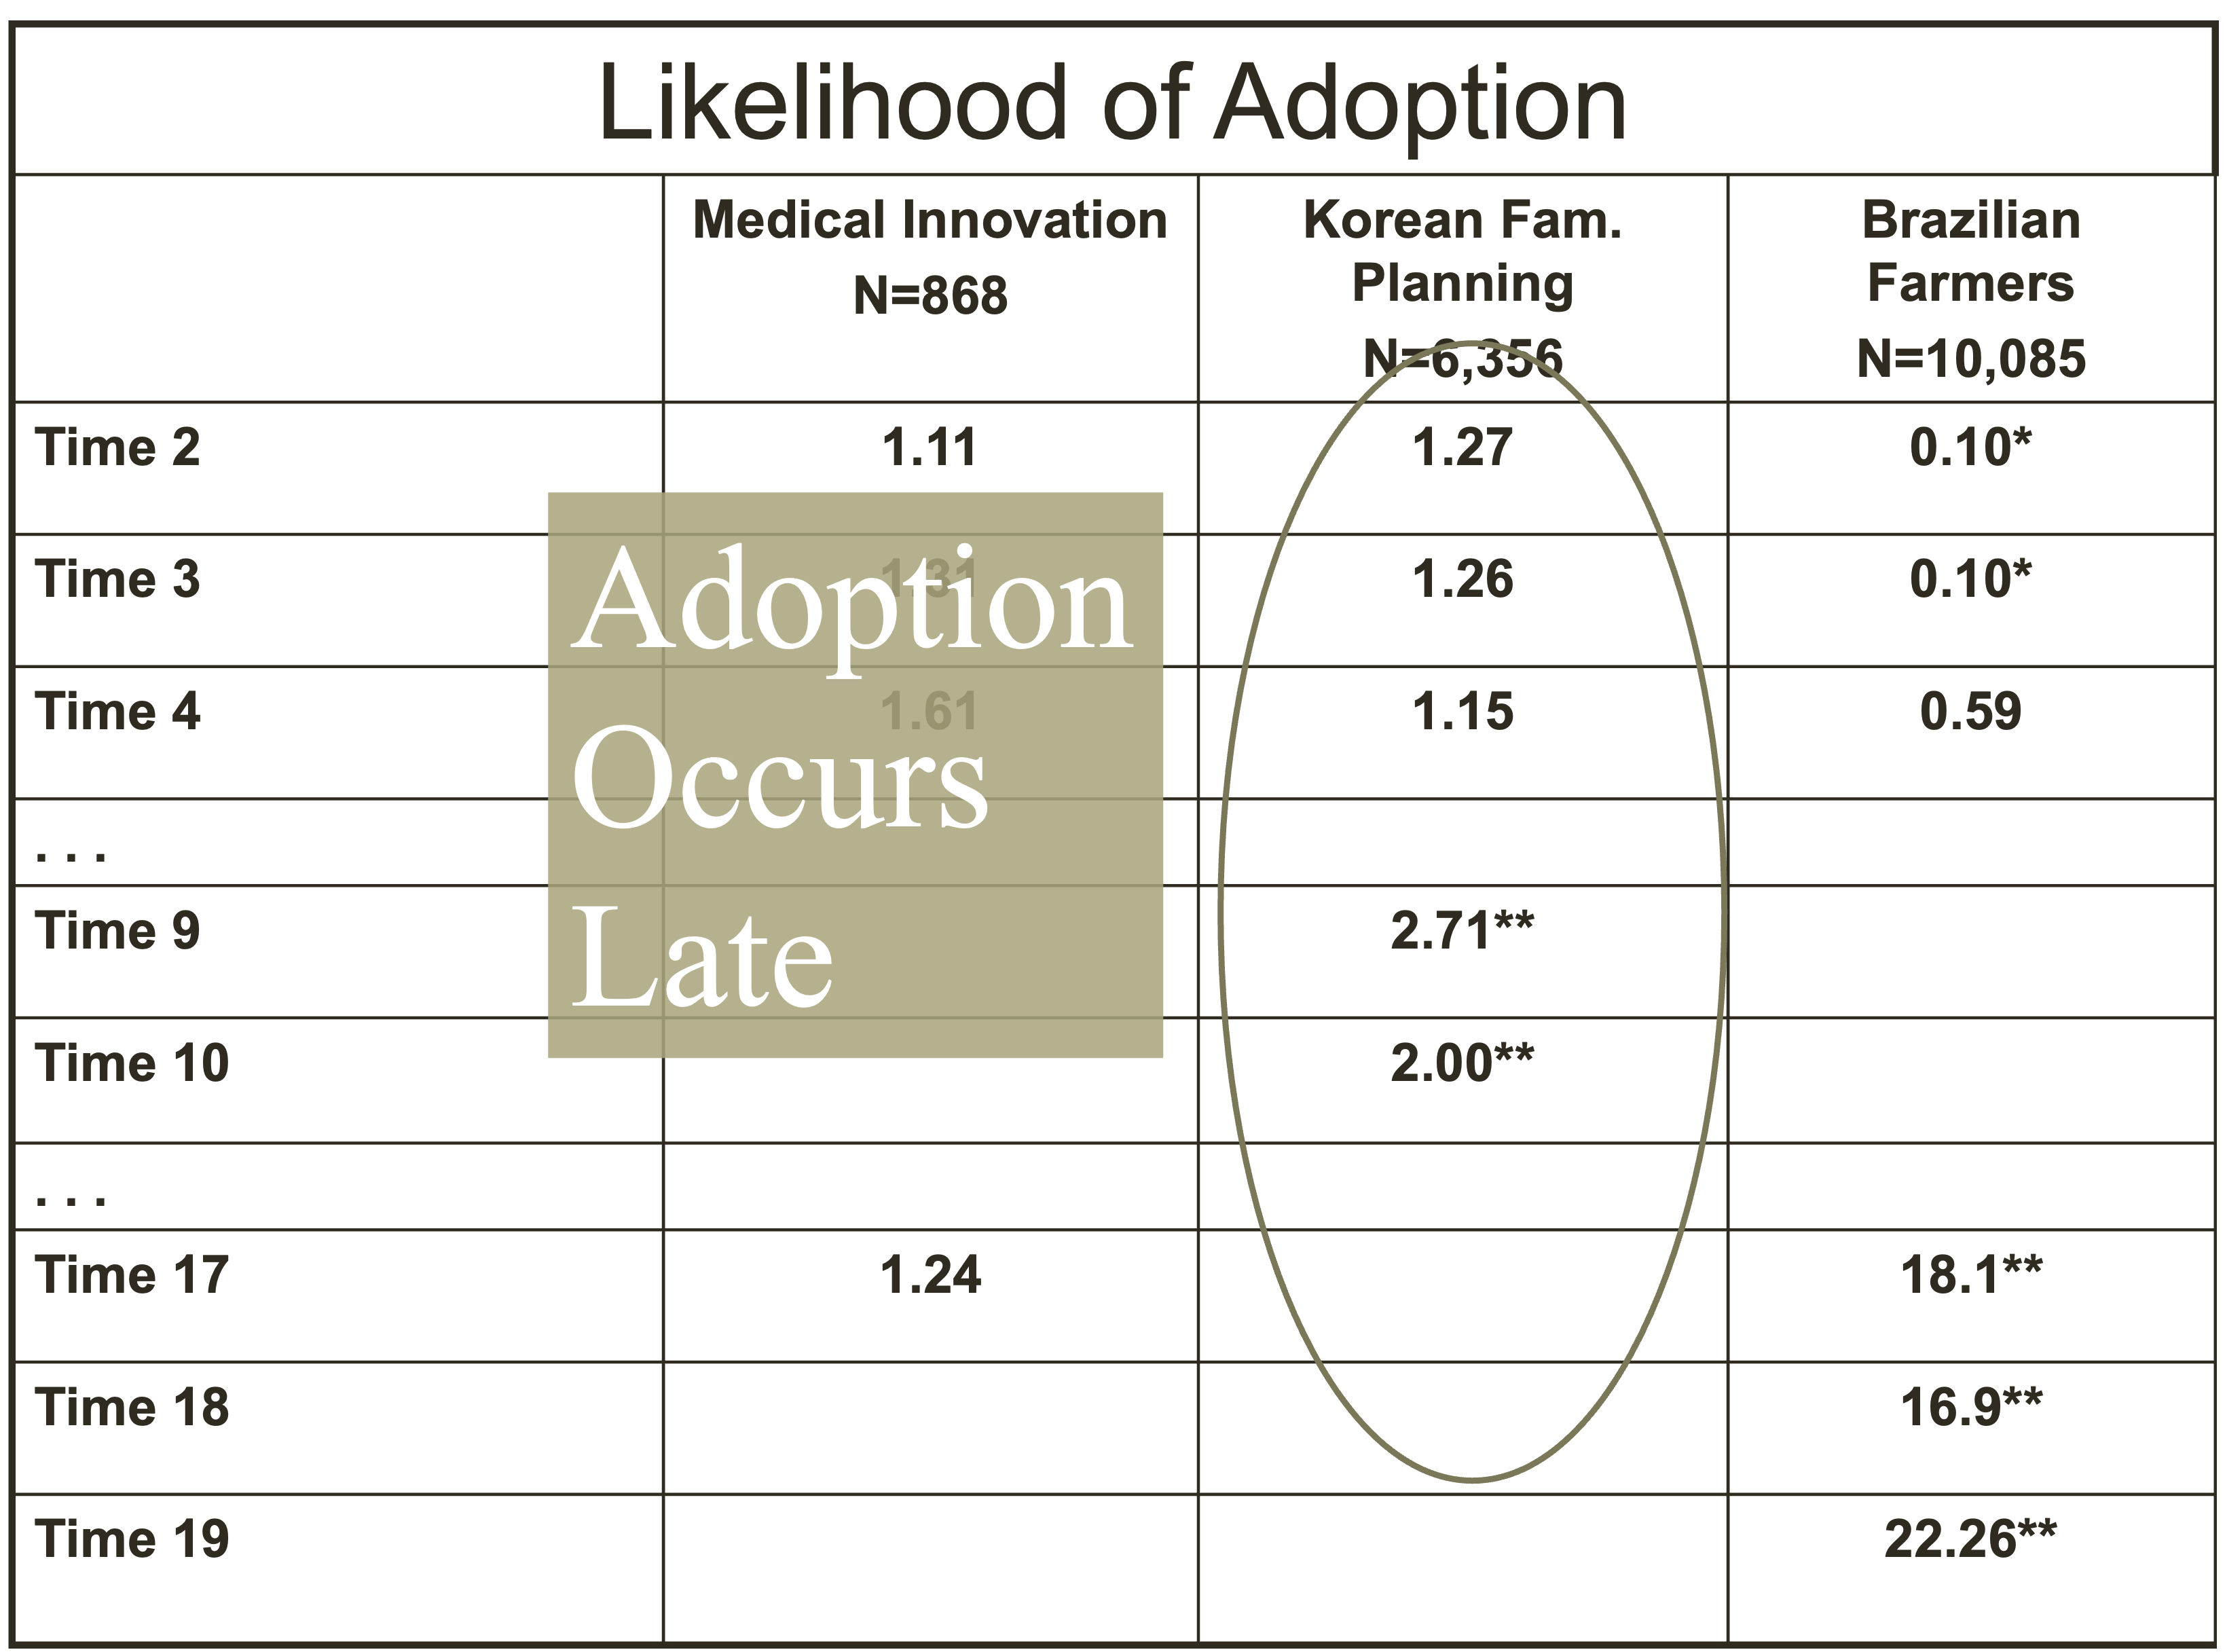
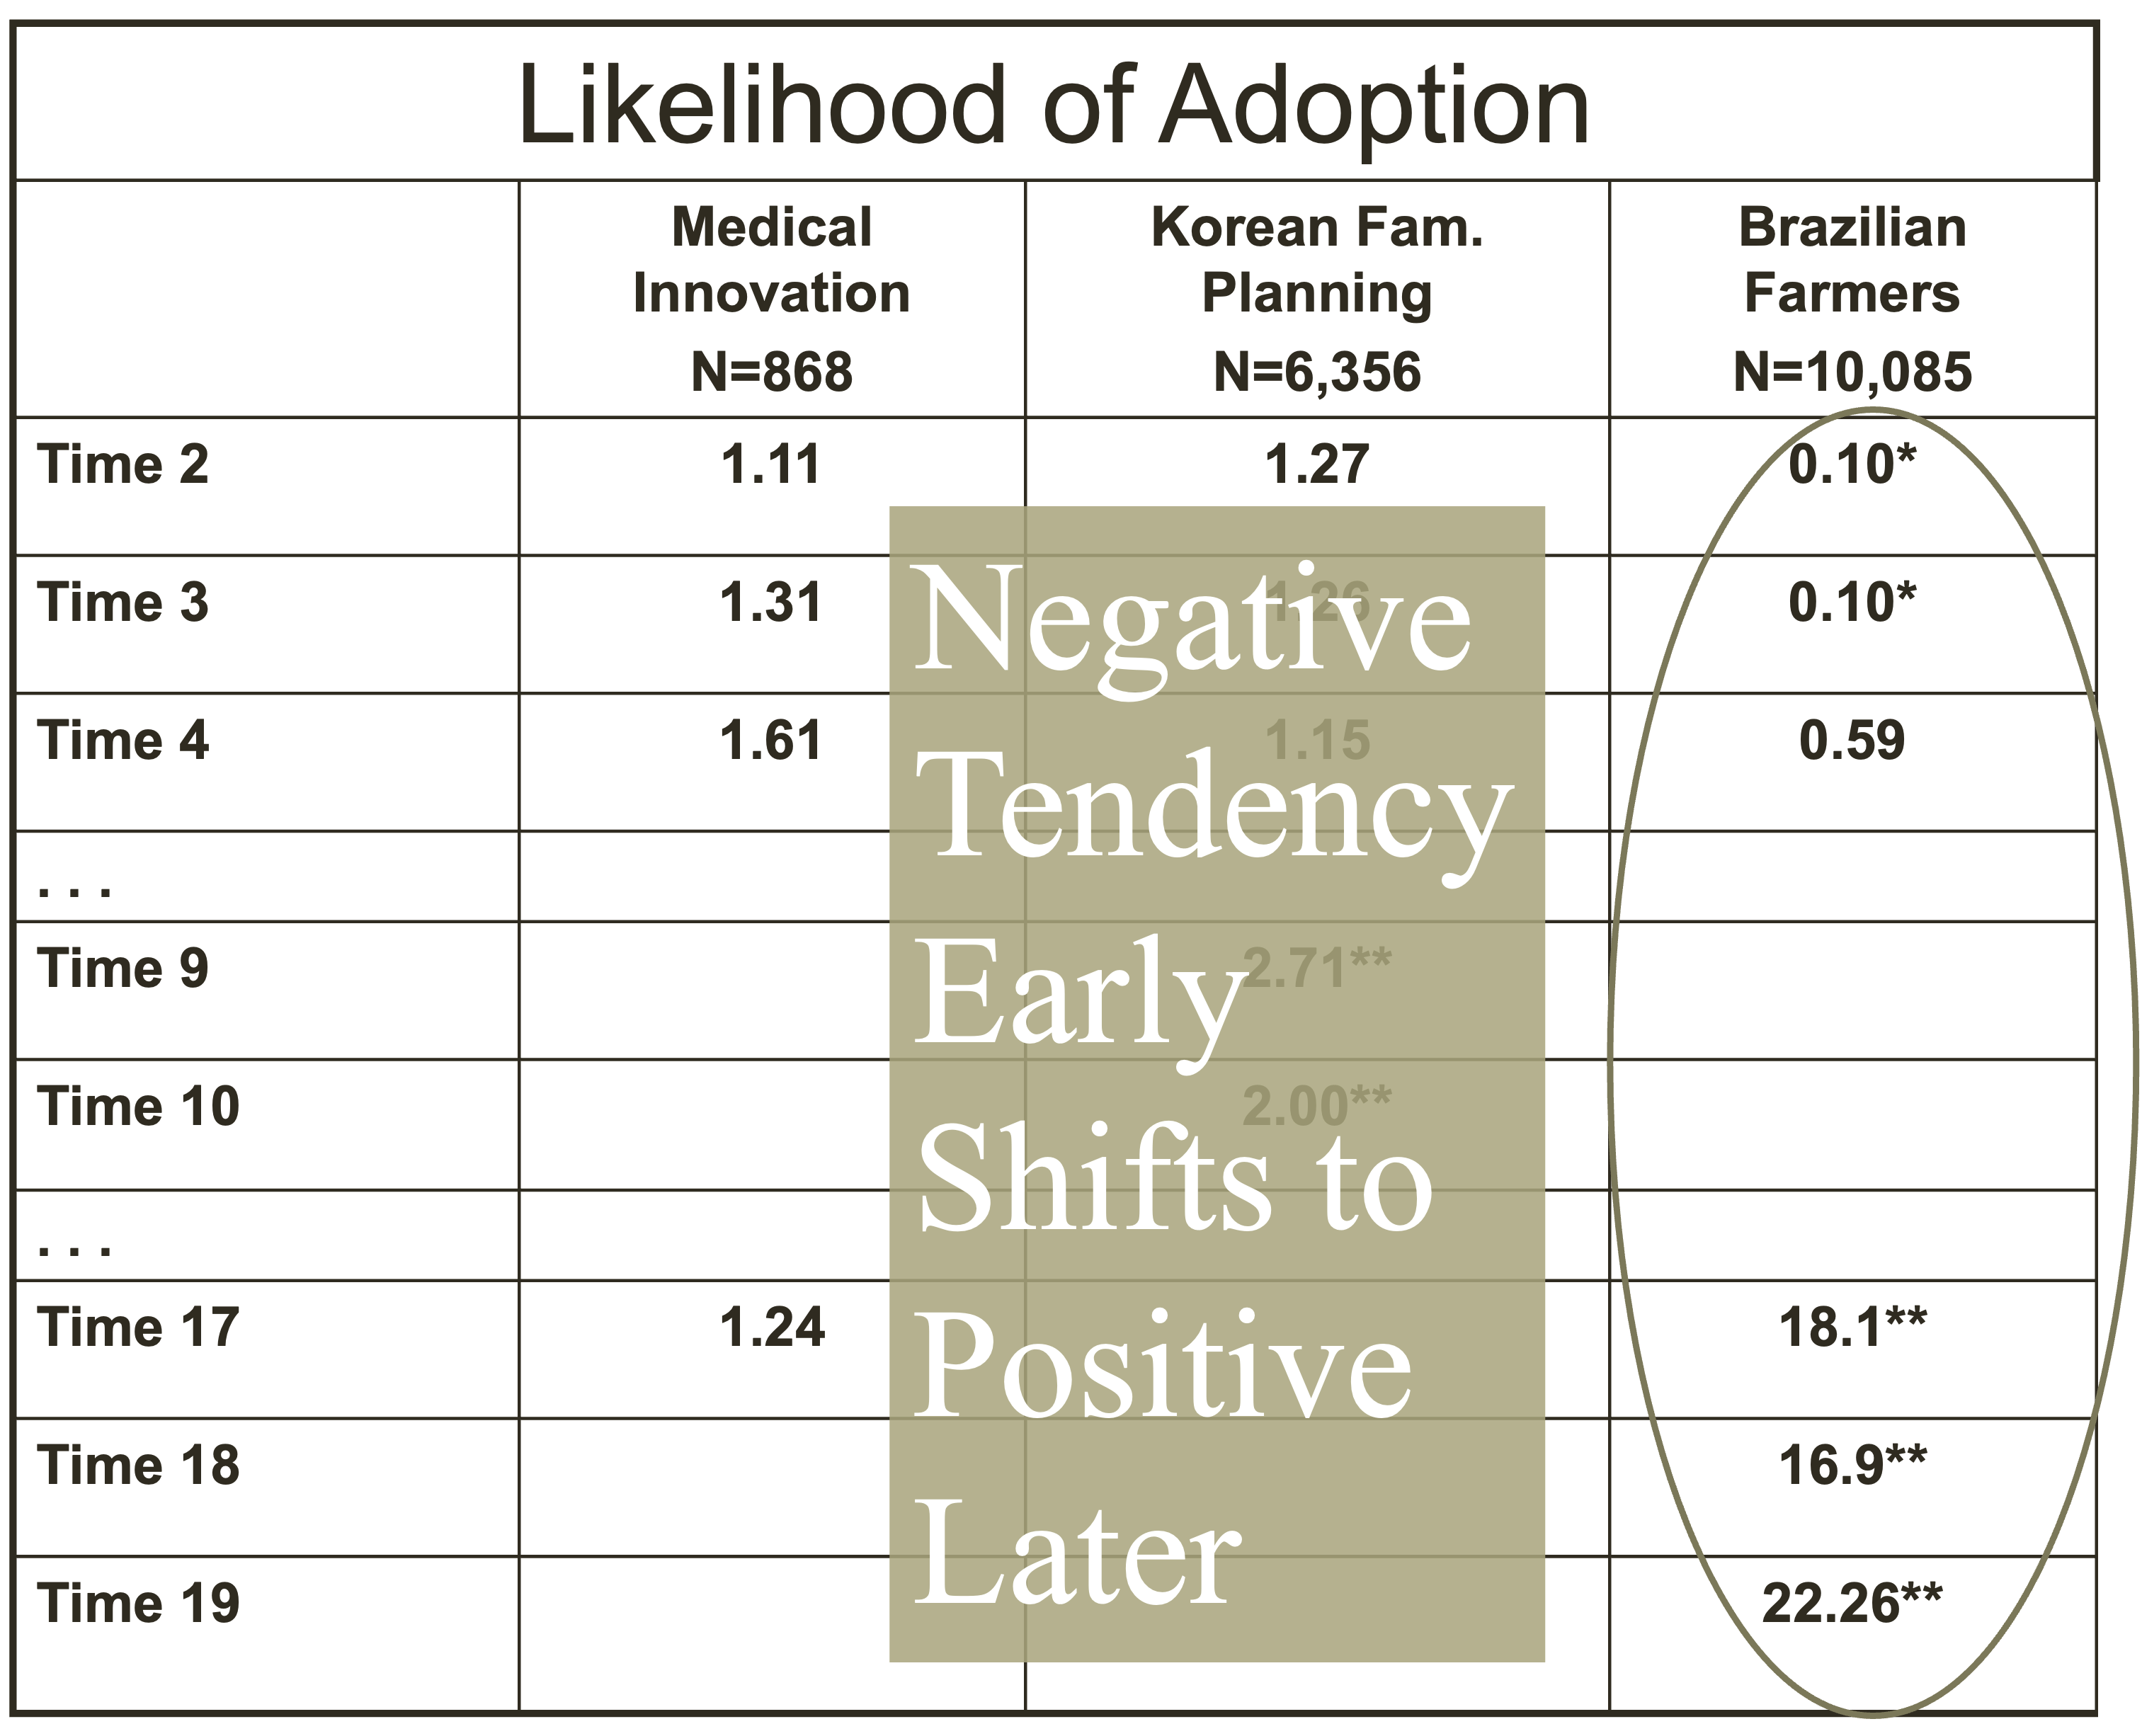
Exposure results
| Term | MI | KFP | BF |
|---|---|---|---|
| Detail Agents | 1.27 | ||
| Science Orientation | 0.60** | ||
| Journals Subs. | 1.63* | ||
| # Sons | 1.43** | ||
| Media Camp. Exp. | 1.10** | ||
| Income | 1.18** | ||
| Visits to City | 1.00 | ||
| Out Degree | 0.96 | 1.05 | 0.98 |
| In Degree | 1.04 | 1.06** | 1.02* |
| Exposure (Cohesion) | 0.94 | 1.16 | 2.16** |
Simulating diffusion
- Seeds:
- Type (central, bridging, marginal, random, etc.)
- Size (e.g., 5%, 10%, 15%)
- Network structure:
- Random
- Small world
- Empirical
- Scale-free (centralized)
- Attribute-based (e.g., homophily)
- Threshold distribution:
- Uniform
- Normal (varying variance)
- Skewed
- Beta
- Mechanism:
- Cohesion
- Structural equivalence
- Indirect ties
- Attribute-based (e.g., homophilous more persuasive)
- Adoption behavior:
- No-disadoption
- Disadoption
- Conflicting behaviors (perhaps coded as -1,0, 1)
- Incorporate uncertainty
Reading Data Challenges
Merging attribute and network data
Nominated but no attribute data
Attribute data no network data
Data file formats
Single flat file
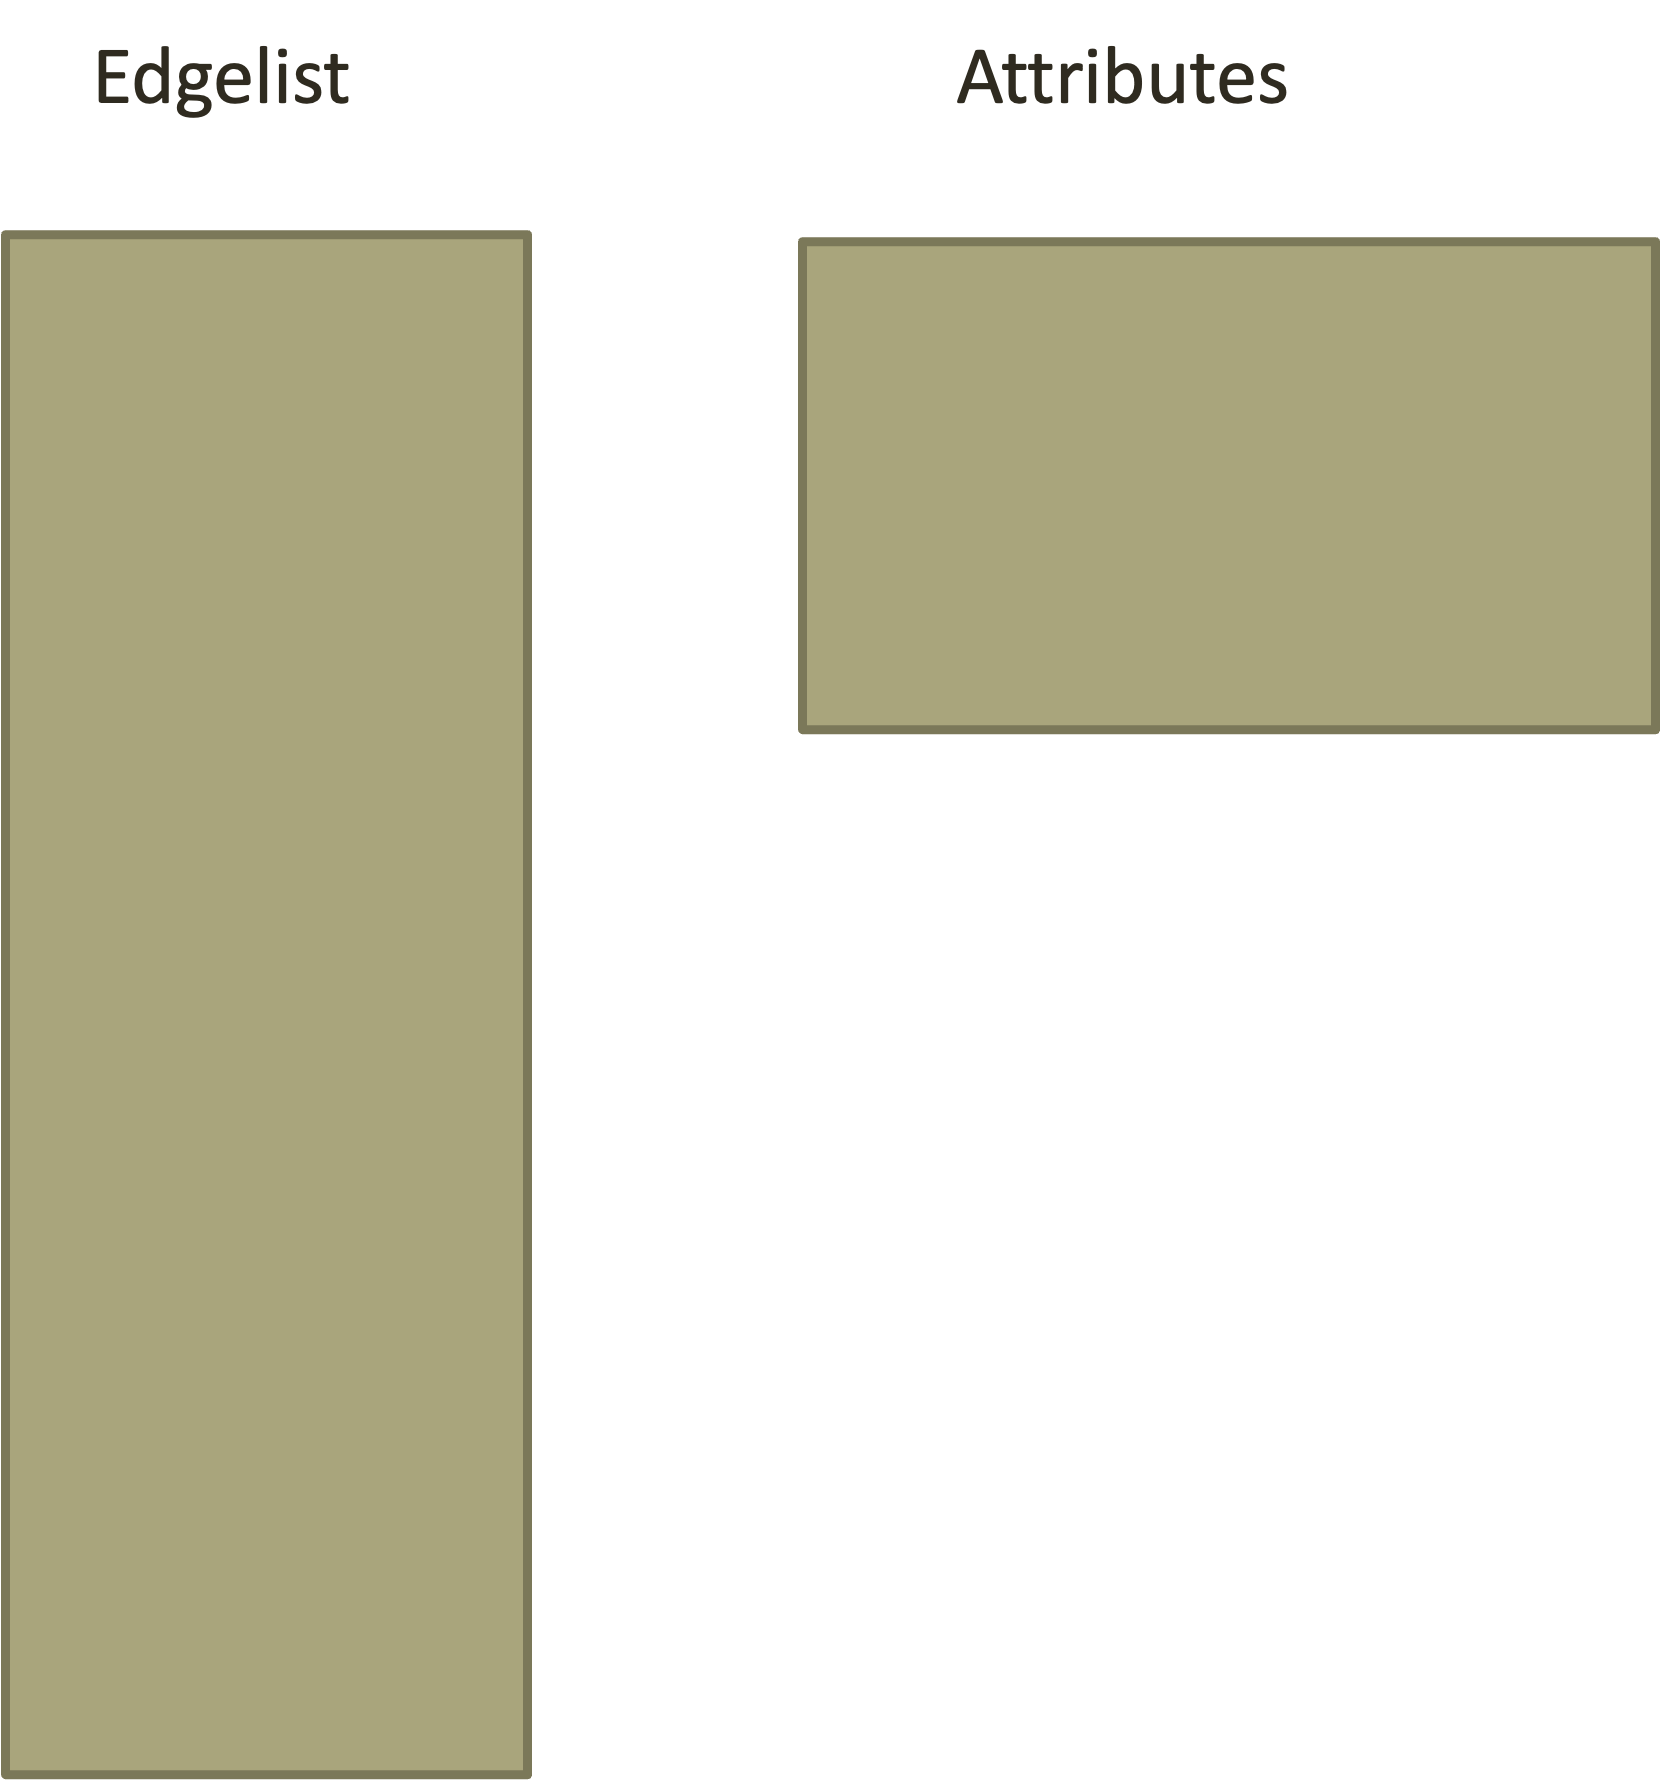
2 files: edgelist and attribute file (flat)
Cohort studies: 1 file separate waves of data
Formats
Survey Data (static & dynamic)
Edge-list and Attribute data
Panel Data
STATNET, Igraph, ….
Input Types: Single Flat File
- Flat File with IDs, Nodelist, and Time of Adoption
- Typically a retrospective study
- Examples, Medical Innovation, Korean Family Planning; Brazilian Farmers

Input Types: Double Files
- Files will have mostly matching IDs
- One or both files may contain time information
- Edgelist may also, potentially, contain values or spell information
Input Types: Classic Cohort/Longitudinal
- IDs and Nodelist Network data
- Behavior is typically binary (e.g., ever smoked) or potentially valued (e.g., # of cigarettes
- Examples SNS
