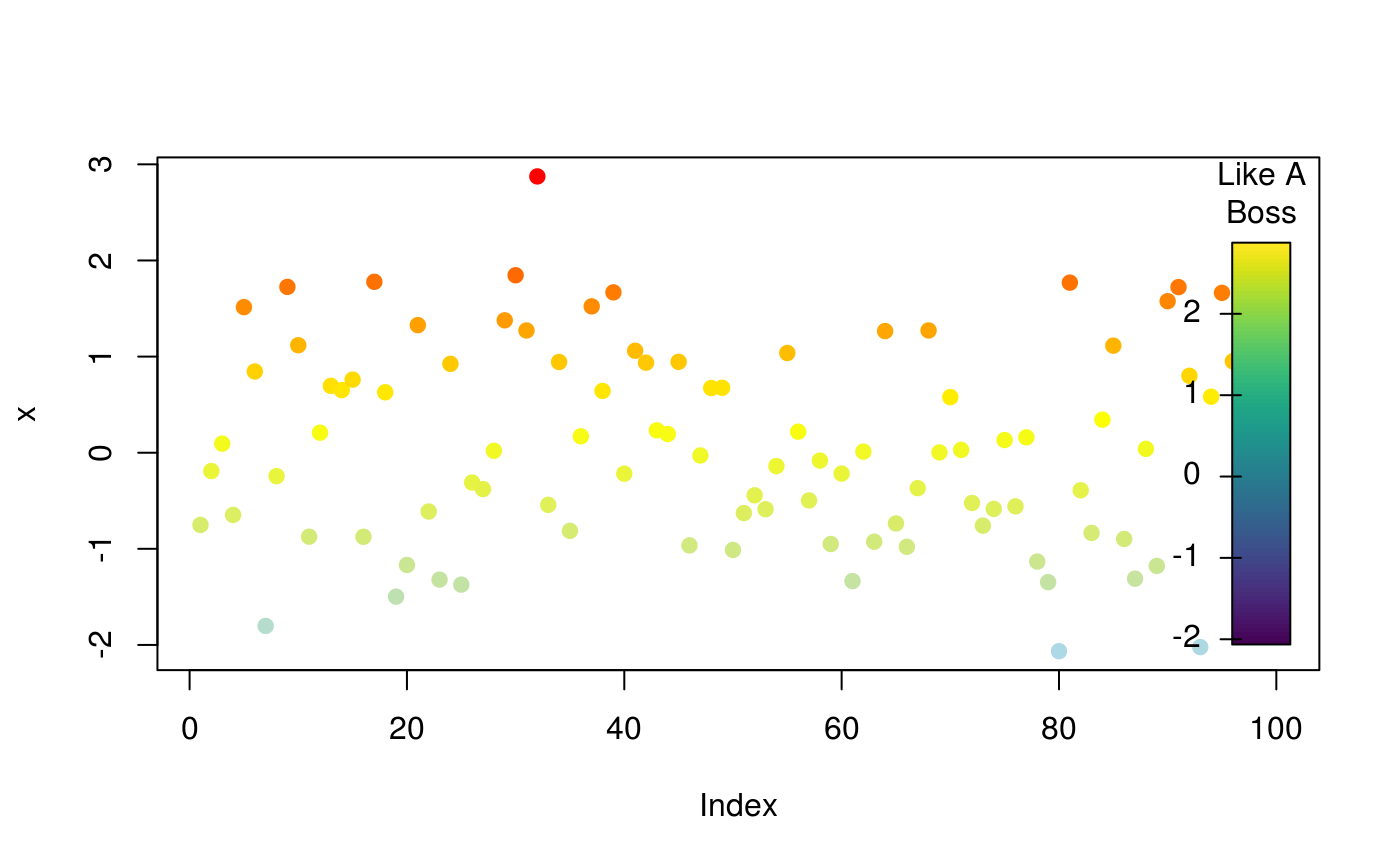
Draw a color key in the current device
drawColorKey(
  x,
  tick.marks = pretty_within(x),
  labels = tick.marks,
  main = NULL,
  key.pos = c(0.925, 0.975, 0.05, 0.95),
  pos = 2,
  nlevels = length(tick.marks),
  color.palette = viridisLite::viridis(nlevels),
  tick.width = c(0.01, 0.0075),
  add.box = TRUE,
  na.col = NULL,
  na.height = 0.1,
  na.lab = "n/a",
  ...
)
Arguments
- x
A numeric vector with the data (it is used to extract the range).
- tick.marks
A numeric vector indicating the levels to be included in the axis.
- labels
Character vector. When provided, specifies using different labels for the tick marks than those provided by
tick.marjks.- main
Character scalar. Title of the key.
- key.pos
A numeric vector of length 4 with relative coordinates of the key (as % of the plotting area, see
par("usr"))- pos
Integer scalar. Position of the axis as in
text.- nlevels
Integer scalar. Number of levels (colors) to include in the color key.
- color.palette
Color palette of
length(nlevels).- tick.width
Numeric vector of length 2 indicating the length of the inner and outer tick marks as percentage of the axis.
- add.box
Logical scalar. When
TRUEadds a box around the key.- na.col
Character scalar. If specified, adds an aditional box indicating the NA color.
- na.height
Numeric scalar. Relative height of the NA box. Only use if
na.colis notNULL.- na.lab
Character scalar. Label of the
NAblock. Only use ifna.colis notNULL.- ...
Further arguments to be passed to
rect
Value
Invisible NULL.
See also
Other visualizations:
dgr(),
diffusionMap(),
grid_distribution(),
hazard_rate(),
plot_adopters(),
plot_diffnet(),
plot_diffnet2(),
plot_infectsuscep(),
plot_threshold(),
rescale_vertex_igraph()