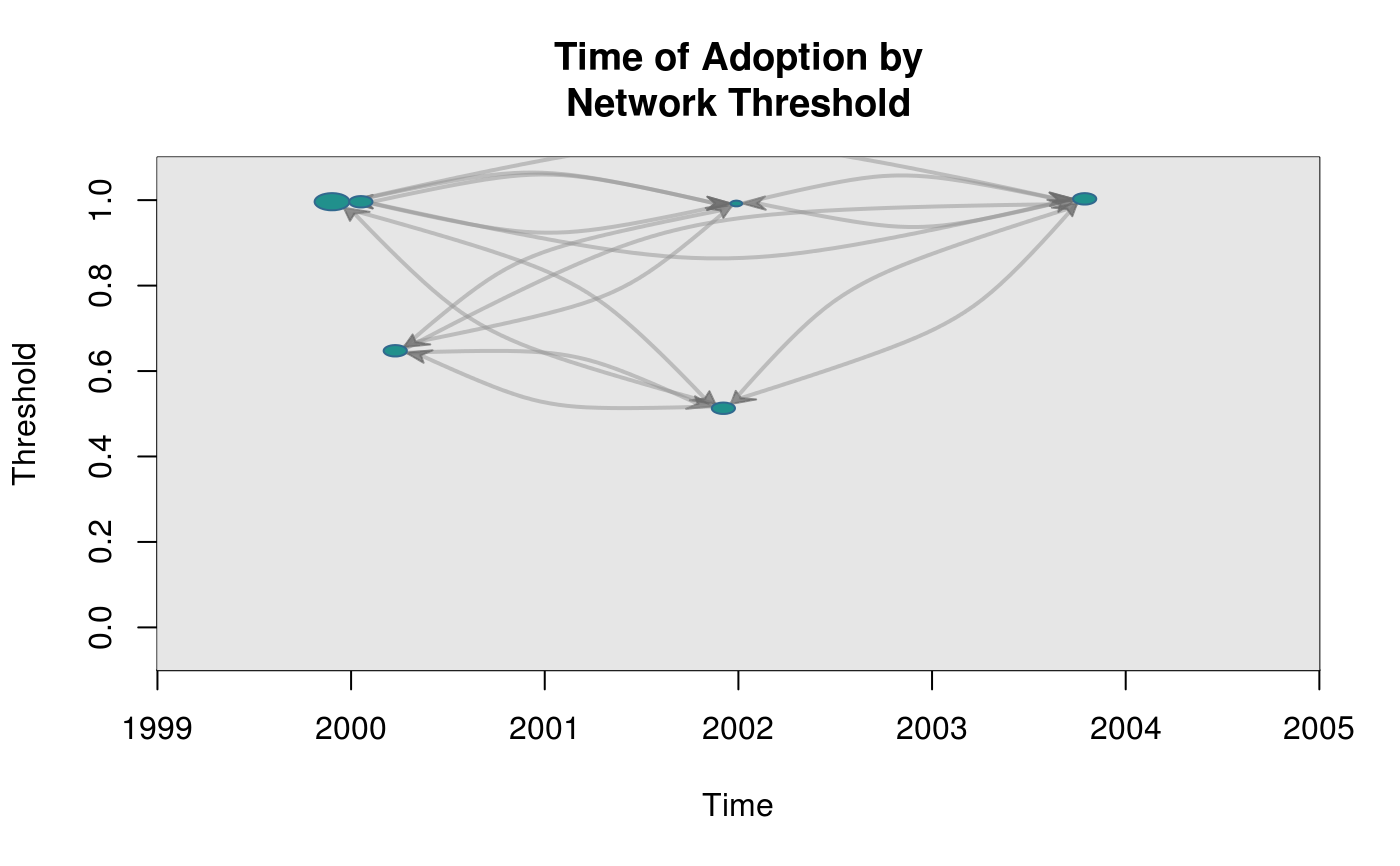
Draws a graph where the coordinates are given by time of adoption, x-axis, and threshold level, y-axis.
plot_threshold(graph, expo, ...)

# S3 method for class 'diffnet'
plot_threshold(graph, expo, ...)

# S3 method for class 'array'
plot_threshold(graph, expo, ...)

# Default S3 method
plot_threshold(
  graph,
  expo,
  toa,
  include_censored = FALSE,
  t0 = min(toa, na.rm = TRUE),
  attrs = NULL,
  undirected = getOption("diffnet.undirected"),
  no.contemporary = TRUE,
  main = "Time of Adoption by\nNetwork Threshold",
  xlab = "Time",
  ylab = "Threshold",
  vertex.size = "degree",
  vertex.color = NULL,
  vertex.label = "",
  vertex.label.pos = NULL,
  vertex.label.cex = 1,
  vertex.label.adj = c(0.5, 0.5),
  vertex.label.color = NULL,
  vertex.sides = 40L,
  vertex.rot = 0,
  edge.width = 2,
  edge.color = NULL,
  arrow.width = NULL,
  arrow.length = NULL,
  arrow.color = NULL,
  include.grid = FALSE,
  vertex.frame.color = NULL,
  bty = "n",
  jitter.factor = c(1, 1),
  jitter.amount = c(0.25, 0.025),
  xlim = NULL,
  ylim = NULL,
  edge.curved = NULL,
  background = NULL,
  ...
)
Arguments
- graph
A dynamic graph (see
netdiffuseR-graphs).- expo
\(n\times T\) matrix. Esposure to the innovation obtained from
exposure- ...
Additional arguments passed to
plot.- toa
Integer vector of length \(n\) with the times of adoption.
- include_censored
Logical scalar. Passed to
threshold.- t0
Integer scalar. Passed to
threshold.- attrs
Passed to
exposure(via threshold).- undirected
Logical scalar. When
TRUEonly the lower triangle of the adjacency matrix will considered (faster).- no.contemporary
Logical scalar. When TRUE, edges for vertices with the same
toawon't be plotted.- main
Character scalar. Title of the plot.
- xlab
Character scalar. x-axis label.
- ylab
Character scalar. y-axis label.
- vertex.size
Numeric vector of size \(n\). Relative size of the vertices.
- vertex.color
Either a vector of size \(n\) or a scalar indicating colors of the vertices.
- vertex.label
Character vector of size \(n\). Labels of the vertices.
- vertex.label.pos
Integer value to be passed to
textviapos.- vertex.label.cex
Either a numeric scalar or vector of size \(n\). Passed to
text.- vertex.label.adj
Passed to
text.- vertex.label.color
Passed to
text.- vertex.sides
Either a vector of size \(n\) or a scalar indicating the number of sides of each vertex (see details).
- vertex.rot
Either a vector of size \(n\) or a scalar indicating the rotation in radians of each vertex (see details).
- edge.width
Numeric. Width of the edges.
- edge.color
Character. Color of the edges.
- arrow.width
Numeric value to be passed to
arrows.- arrow.length
Numeric value to be passed to
arrows.- arrow.color
Color.
- include.grid
Logical. When TRUE, the grid of the graph is drawn.
- vertex.frame.color
Either a vector of size \(n\) or a scalar indicating colors of vertices' borders.
- bty
See
par.- jitter.factor
Numeric vector of size 2 (for x and y) passed to
jitter.- jitter.amount
Numeric vector of size 2 (for x and y) passed to
jitter.- xlim
Passed to
plot.- ylim
Passed to
plot.- edge.curved
Logical scalar. When curved, generates curved edges.
- background
TBD
Value
Invisible. A data frame with the calculated coordinates, including: `toa`, `threshold`, and `jit` (a jittered version of `toa`).
Details
When vertex.label=NULL the function uses vertices ids as labels.
By default vertex.label="" plots no labels.
Vertices are drawn using an internal function for generating polygons.
Polygons are inscribed in a circle of radius vertex.size, and can be
rotated using vertex.rot. The number of sides of each polygon
is set via vertex.sides.
See also
Use threshold to retrieve the corresponding threshold
obtained returned by exposure.
Other visualizations:
dgr(),
diffusionMap(),
drawColorKey(),
grid_distribution(),
hazard_rate(),
plot_adopters(),
plot_diffnet(),
plot_diffnet2(),
plot_infectsuscep(),
rescale_vertex_igraph()
Examples
# Generating a random graph
set.seed(1234)
n <- 6
nper <- 5
graph <- rgraph_er(n,nper, p=.3, undirected = FALSE)
toa <- sample(2000:(2000+nper-1), n, TRUE)
adopt <- toa_mat(toa)
# Computing exposure
expos <- exposure(graph, adopt$cumadopt)
plot_threshold(graph, expos, toa)
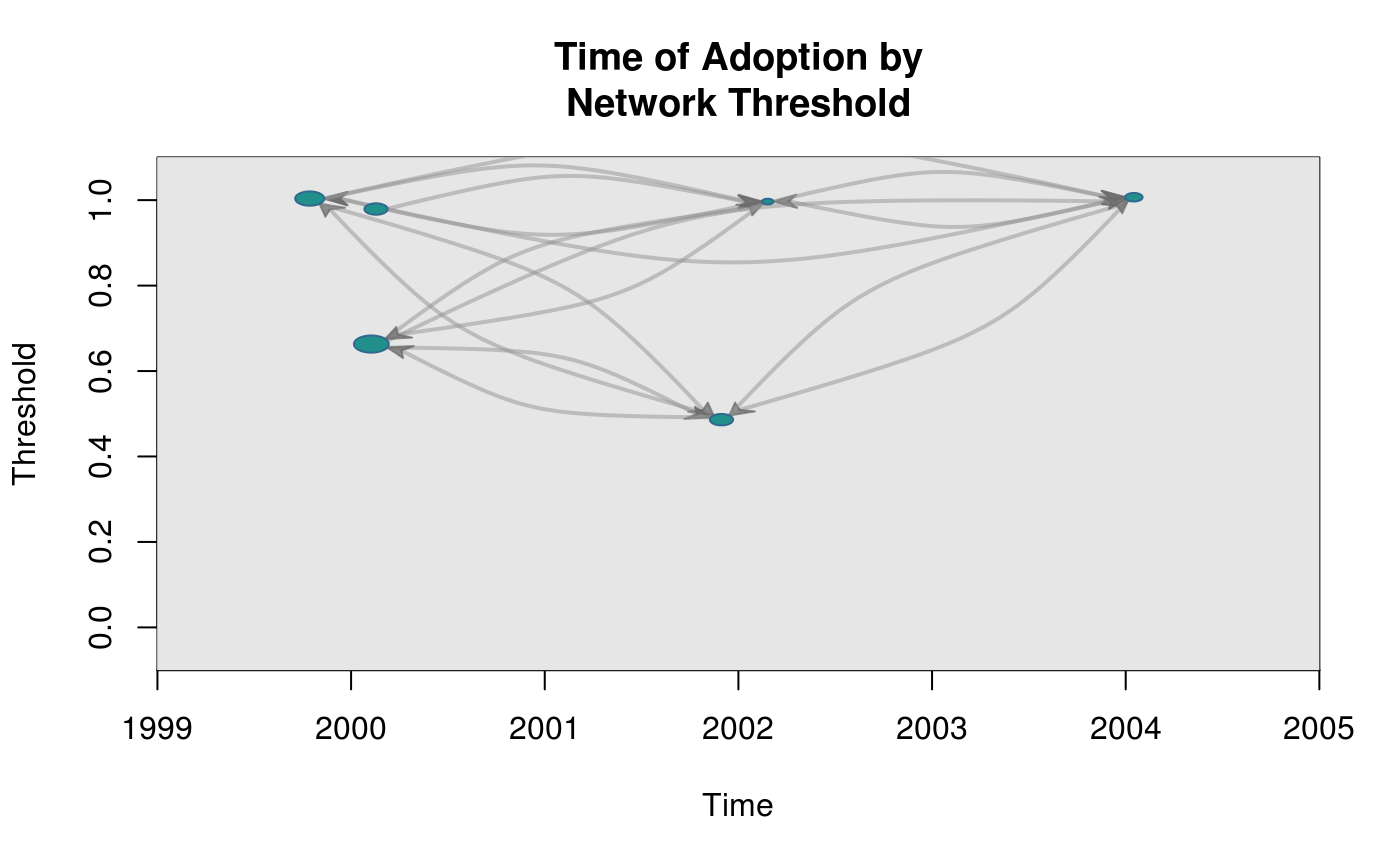 # Calculating degree (for sizing the vertices)
plot_threshold(graph, expos, toa, vertex.size = "indegree")
# Calculating degree (for sizing the vertices)
plot_threshold(graph, expos, toa, vertex.size = "indegree")