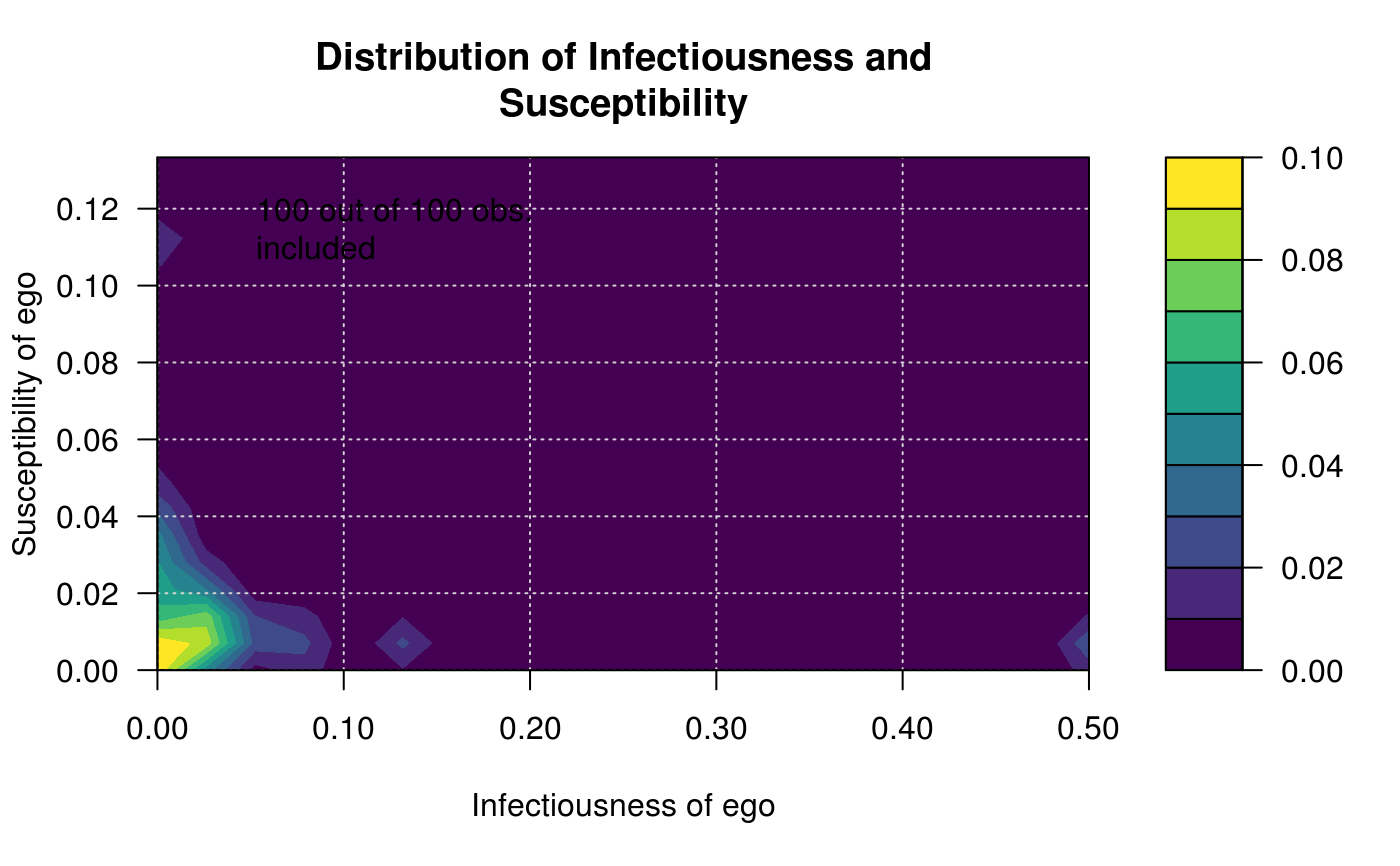
After calculating infectiousness and susceptibility of each individual on the
network, it creates an nlevels by nlevels matrix indicating the
number of individuals that lie within each cell, and draws a heatmap.
plot_infectsuscep(
  graph,
  toa,
  t0 = NULL,
  normalize = TRUE,
  K = 1L,
  r = 0.5,
  expdiscount = FALSE,
  bins = 20,
  nlevels = round(bins/2),
  h = NULL,
  logscale = TRUE,
  main = "Distribution of Infectiousness and\nSusceptibility",
  xlab = "Infectiousness of ego",
  ylab = "Susceptibility of ego",
  sub = ifelse(logscale, "(in log-scale)", NA),
  color.palette = function(n) viridisLite::viridis(n),
  include.grid = TRUE,
  exclude.zeros = FALSE,
  valued = getOption("diffnet.valued", FALSE),
  ...
)
Arguments
- graph
A dynamic graph (see
netdiffuseR-graphs).- toa
Integer vector of length \(n\) with the times of adoption.
- t0
Integer scalar. See
toa_mat.- normalize
Logical scalar. Passed to infection/susceptibility.
- K
Integer scalar. Passed to infection/susceptibility.
- r
Numeric scalar. Passed to infection/susceptibility.
- expdiscount
Logical scalar. Passed to infection/susceptibility.
- bins
Integer scalar. Size of the grid (\(n\)).
- nlevels
Integer scalar. Number of levels to plot (see
filled.contour).- h
Numeric vector of length 2. Passed to
kde2din the MASS package.- logscale
Logical scalar. When TRUE the axis of the plot will be presented in log-scale.
- main
Character scalar. Title of the graph.
- xlab
Character scalar. Title of the x-axis.
- ylab
Character scalar. Title of the y-axis.
- sub
Character scalar. Subtitle of the graph.
- color.palette
a color palette function to be used to assign colors in the plot (see
filled.contour).- include.grid
Logical scalar. When TRUE, the grid of the graph is drawn.
- exclude.zeros
Logical scalar. When TRUE, observations with zero values
- valued
Logical scalar. When FALSE non-zero values in the adjmat are set to one. in infect or suscept are excluded from the graph. This is done explicitly when
logscale=TRUE.- ...
Additional parameters to be passed to
filled.contour.
Value
A list with three elements:
- infect
A numeric vector of size \(n\) with infectiousness levels
- suscep
A numeric vector of size \(n\) with susceptibility levels
- coords
A list containing the class marks and counts used to draw the plot via
filled.contour(seegrid_distribution)- complete
A logical vector with
TRUEwhen the case was included in the plot. (this is relevant wheneverlogscale=TRUE)
Details
This plotting function was inspired by Aral, S., & Walker, D. (2012).
By default the function will try to apply a kernel smooth function via
kde2d. If not possible (because not enought data points), then
the user should try changing the parameter h or set it equal to zero.
toa is passed to infection/susceptibility.
References
Aral, S., & Walker, D. (2012). "Identifying Influential and Susceptible Members of Social Networks". Science, 337(6092), 337–341. doi:10.1126/science.1215842
See also
Infectiousness and susceptibility are computed via infection and
susceptibility.
Other visualizations:
dgr(),
diffusionMap(),
drawColorKey(),
grid_distribution(),
hazard_rate(),
plot_adopters(),
plot_diffnet(),
plot_diffnet2(),
plot_threshold(),
rescale_vertex_igraph()
Examples
# Generating a random graph -------------------------------------------------
set.seed(1234)
n <- 100
nper <- 20
graph <- rgraph_er(n,nper, p=.2, undirected = FALSE)
toa <- sample(1:(1+nper-1), n, TRUE)

# Visualizing distribution of suscep/infect
out <- plot_infectsuscep(graph, toa, K=3, logscale = FALSE)